







Beta status: v0.5.4, fully functional, actively developed. Report issues via GitHub Issues.
Demo / training videos
▶ Watch the v0.5.x update video on YouTube — Graph view, settings persistence, Star layout, and the macOS crash fix.
▶ Watch the v0.4.x feature video on YouTube — protocol info dialogs, Wi-Fi mode, bidirectional filtering, and more.
▶ PacketCircle v0.4.7 Quickstart Training on YouTube — step-by-step walkthrough for new users.
📖 Training materials — written guides, use-case walkthroughs, and classroom exercises.
What it does
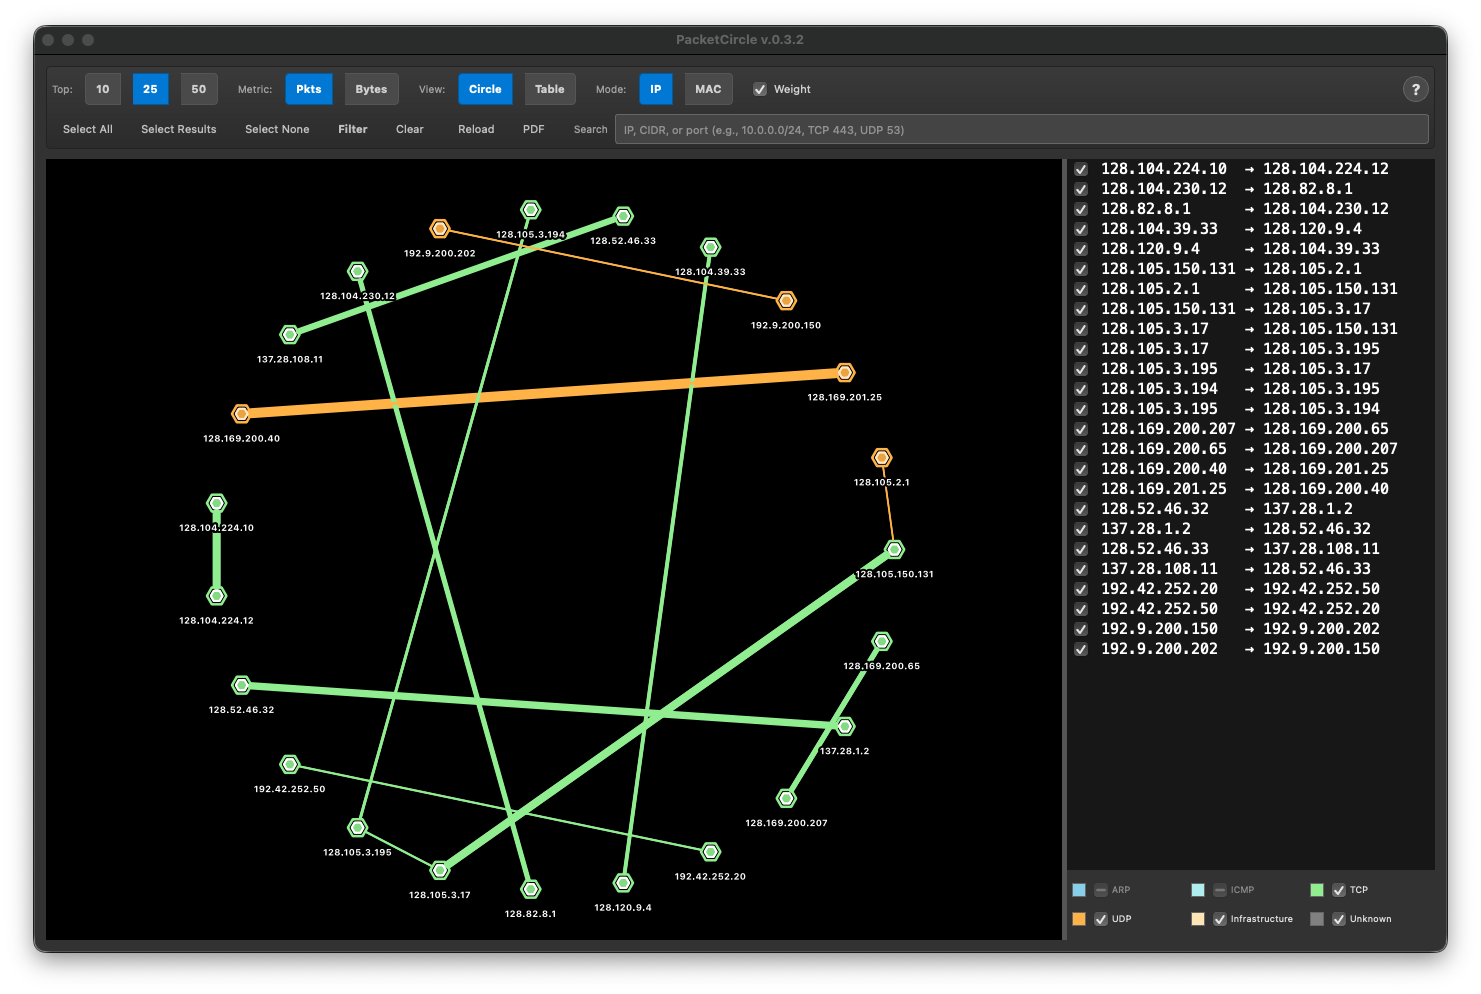
Hosts as nodes on a circle, connections as arcs — colored by protocol, weighted by traffic volume.
See who is talking to whom, using which protocol, and how much — instantly, from any PCAP or live capture.
| Capability | Description |
|---|---|
| Circle visualization | Hosts as nodes, connections as arcs — colored by protocol, sized by volume |
| Graph view | Interactive node-link topology diagram with 8 layouts, TCP Health / Anomaly Score / High Risk edge coloring, node color modes, and score breakdowns — enable via Experimental install |
| 20+ protocol info dialogs | Right-click any connection: TLS certs, HTTP headers, FTP credentials, DNS answers, SSH key exchange, Kerberos tickets, and more |
| Wi-Fi monitoring mode | Visualize 802.11 captures with RSSI signal-quality color coding |
| Smart search | Search by IP, CIDR, port (TCP 443), protocol keyword (TLS, SSH, SNMP, …), or any Wireshark display filter |
| Wireshark integration | Apply display filters, follow TCP streams, open throughput/RTT graphs — all from within PacketCircle |
| ntopng & Malcolm/Arkime | One-click send to ntopng or upload PCAP to Malcolm/Arkime with automatic Arkime session filter |
| 3-page PDF reports | Cover page with metadata, visualization + pair list, and plain-language explanation page |
| Cross-platform | macOS Universal Binary (Intel + Apple Silicon), Linux x86_64, Windows x86_64 |
Screenshots
Circle view & filtering
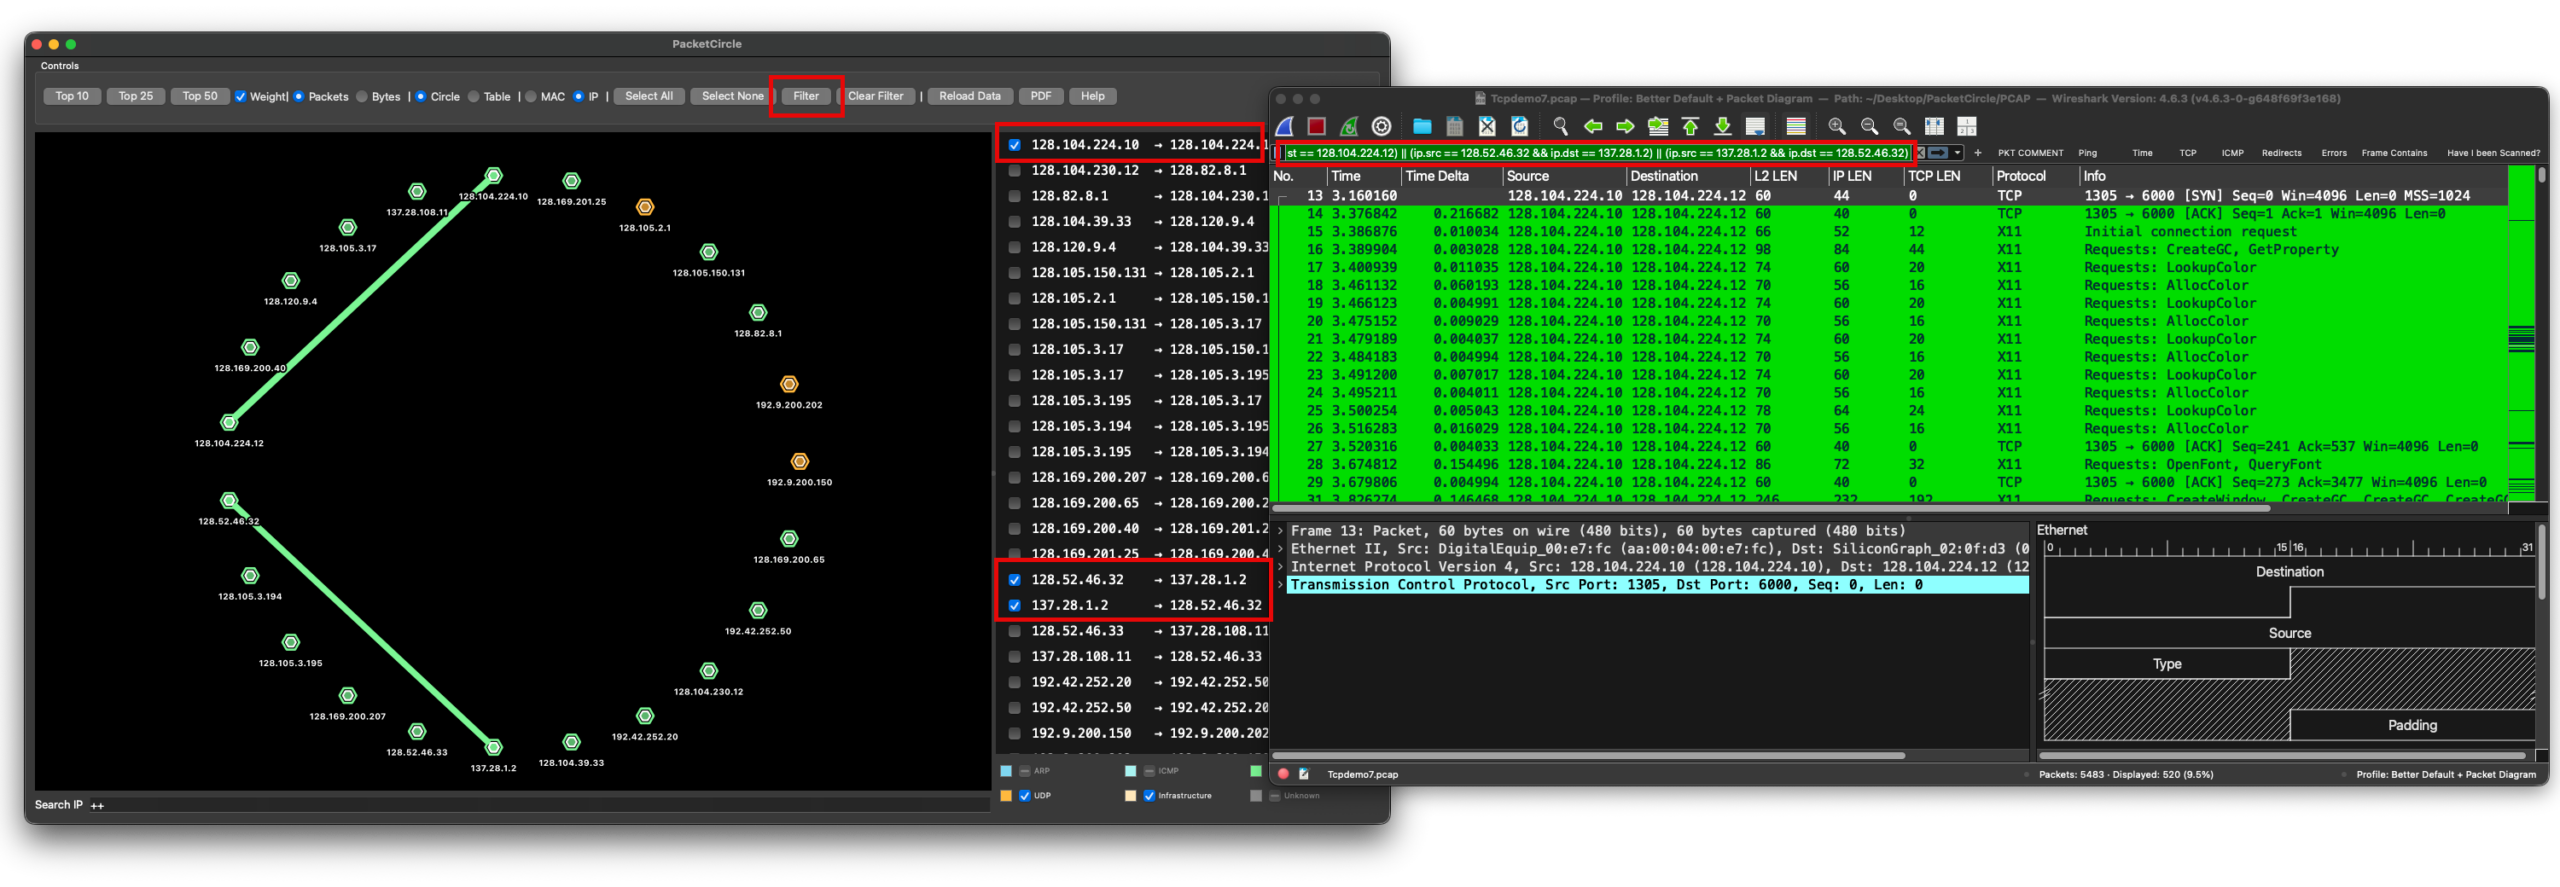
Select a pair and apply a precise Wireshark display filter directly from the circle.
Protocol information dialogs
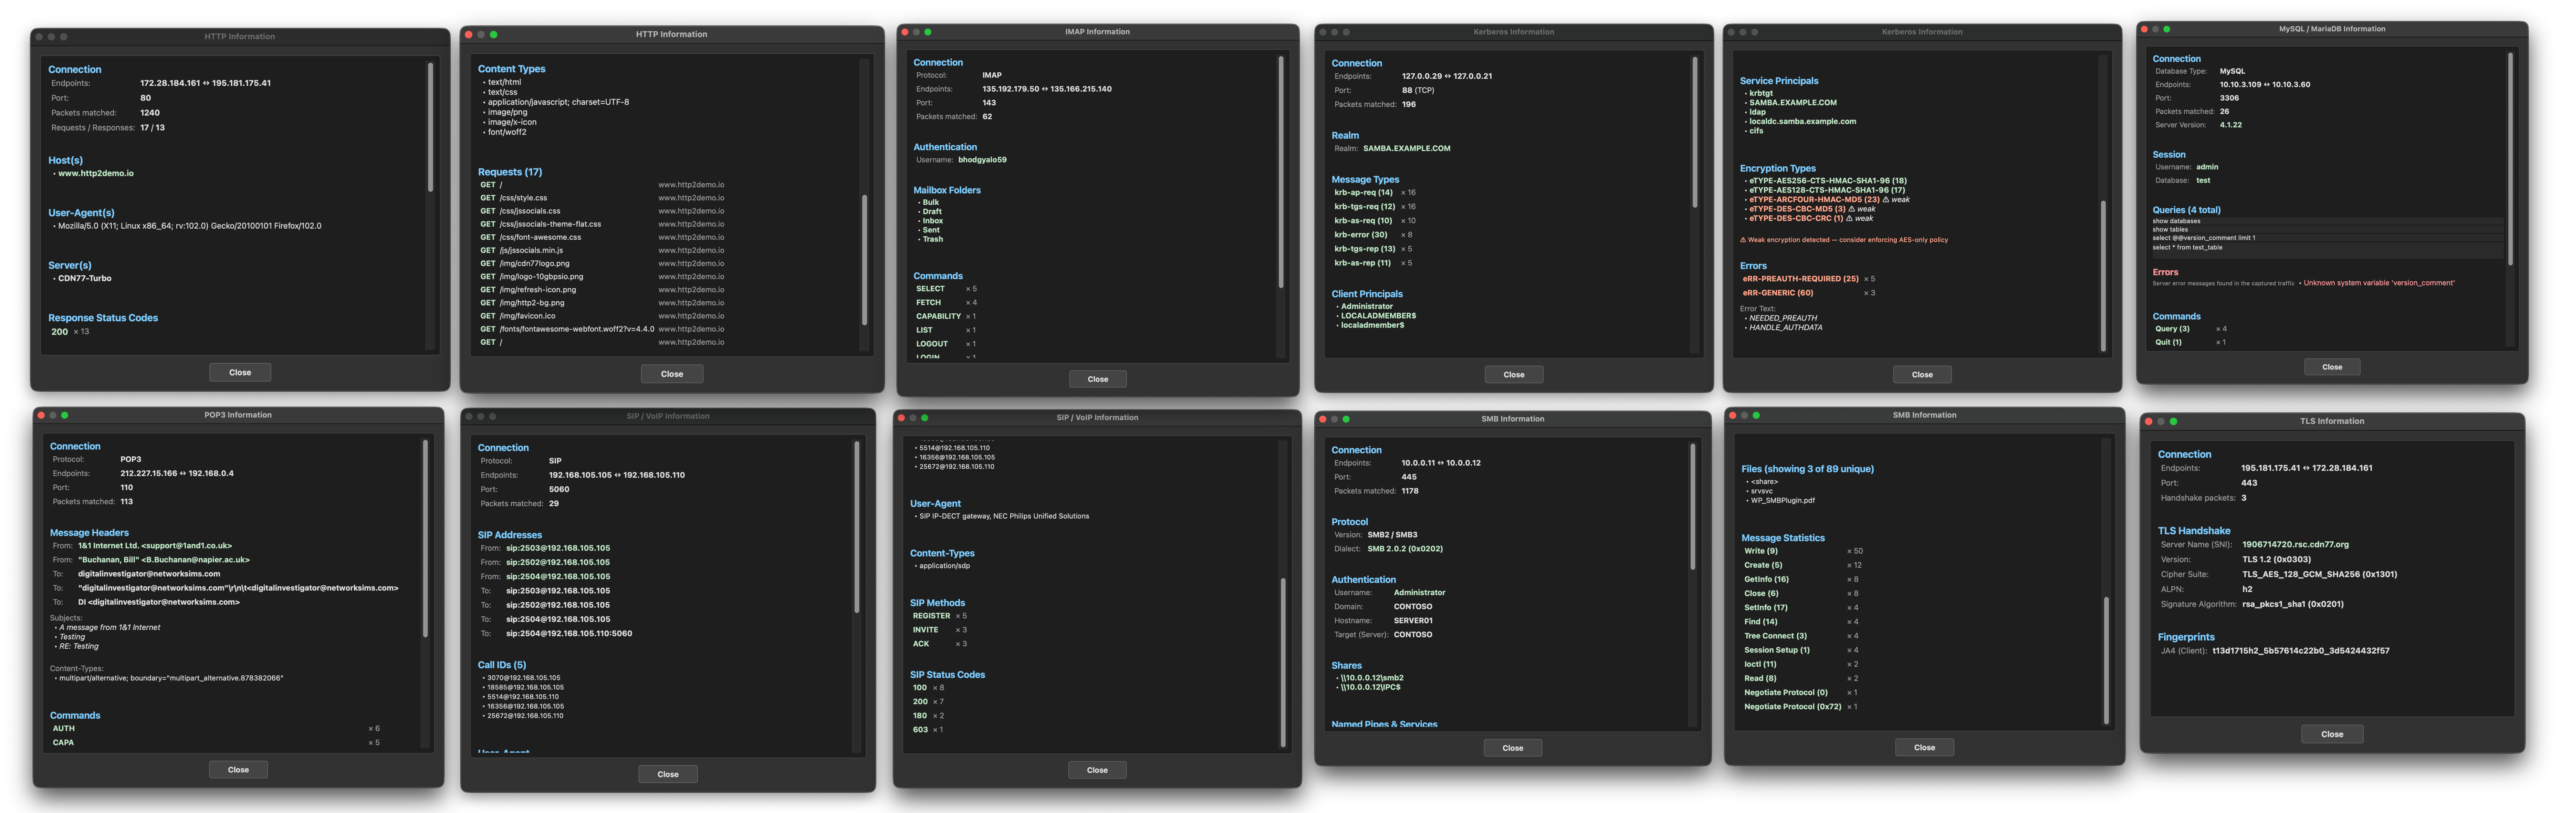
Right-click any connection line: HTTP, TLS/SSL, SMB, Kerberos, Email, SQL, VoIP — and 13 more protocols.
Wi-Fi monitoring mode
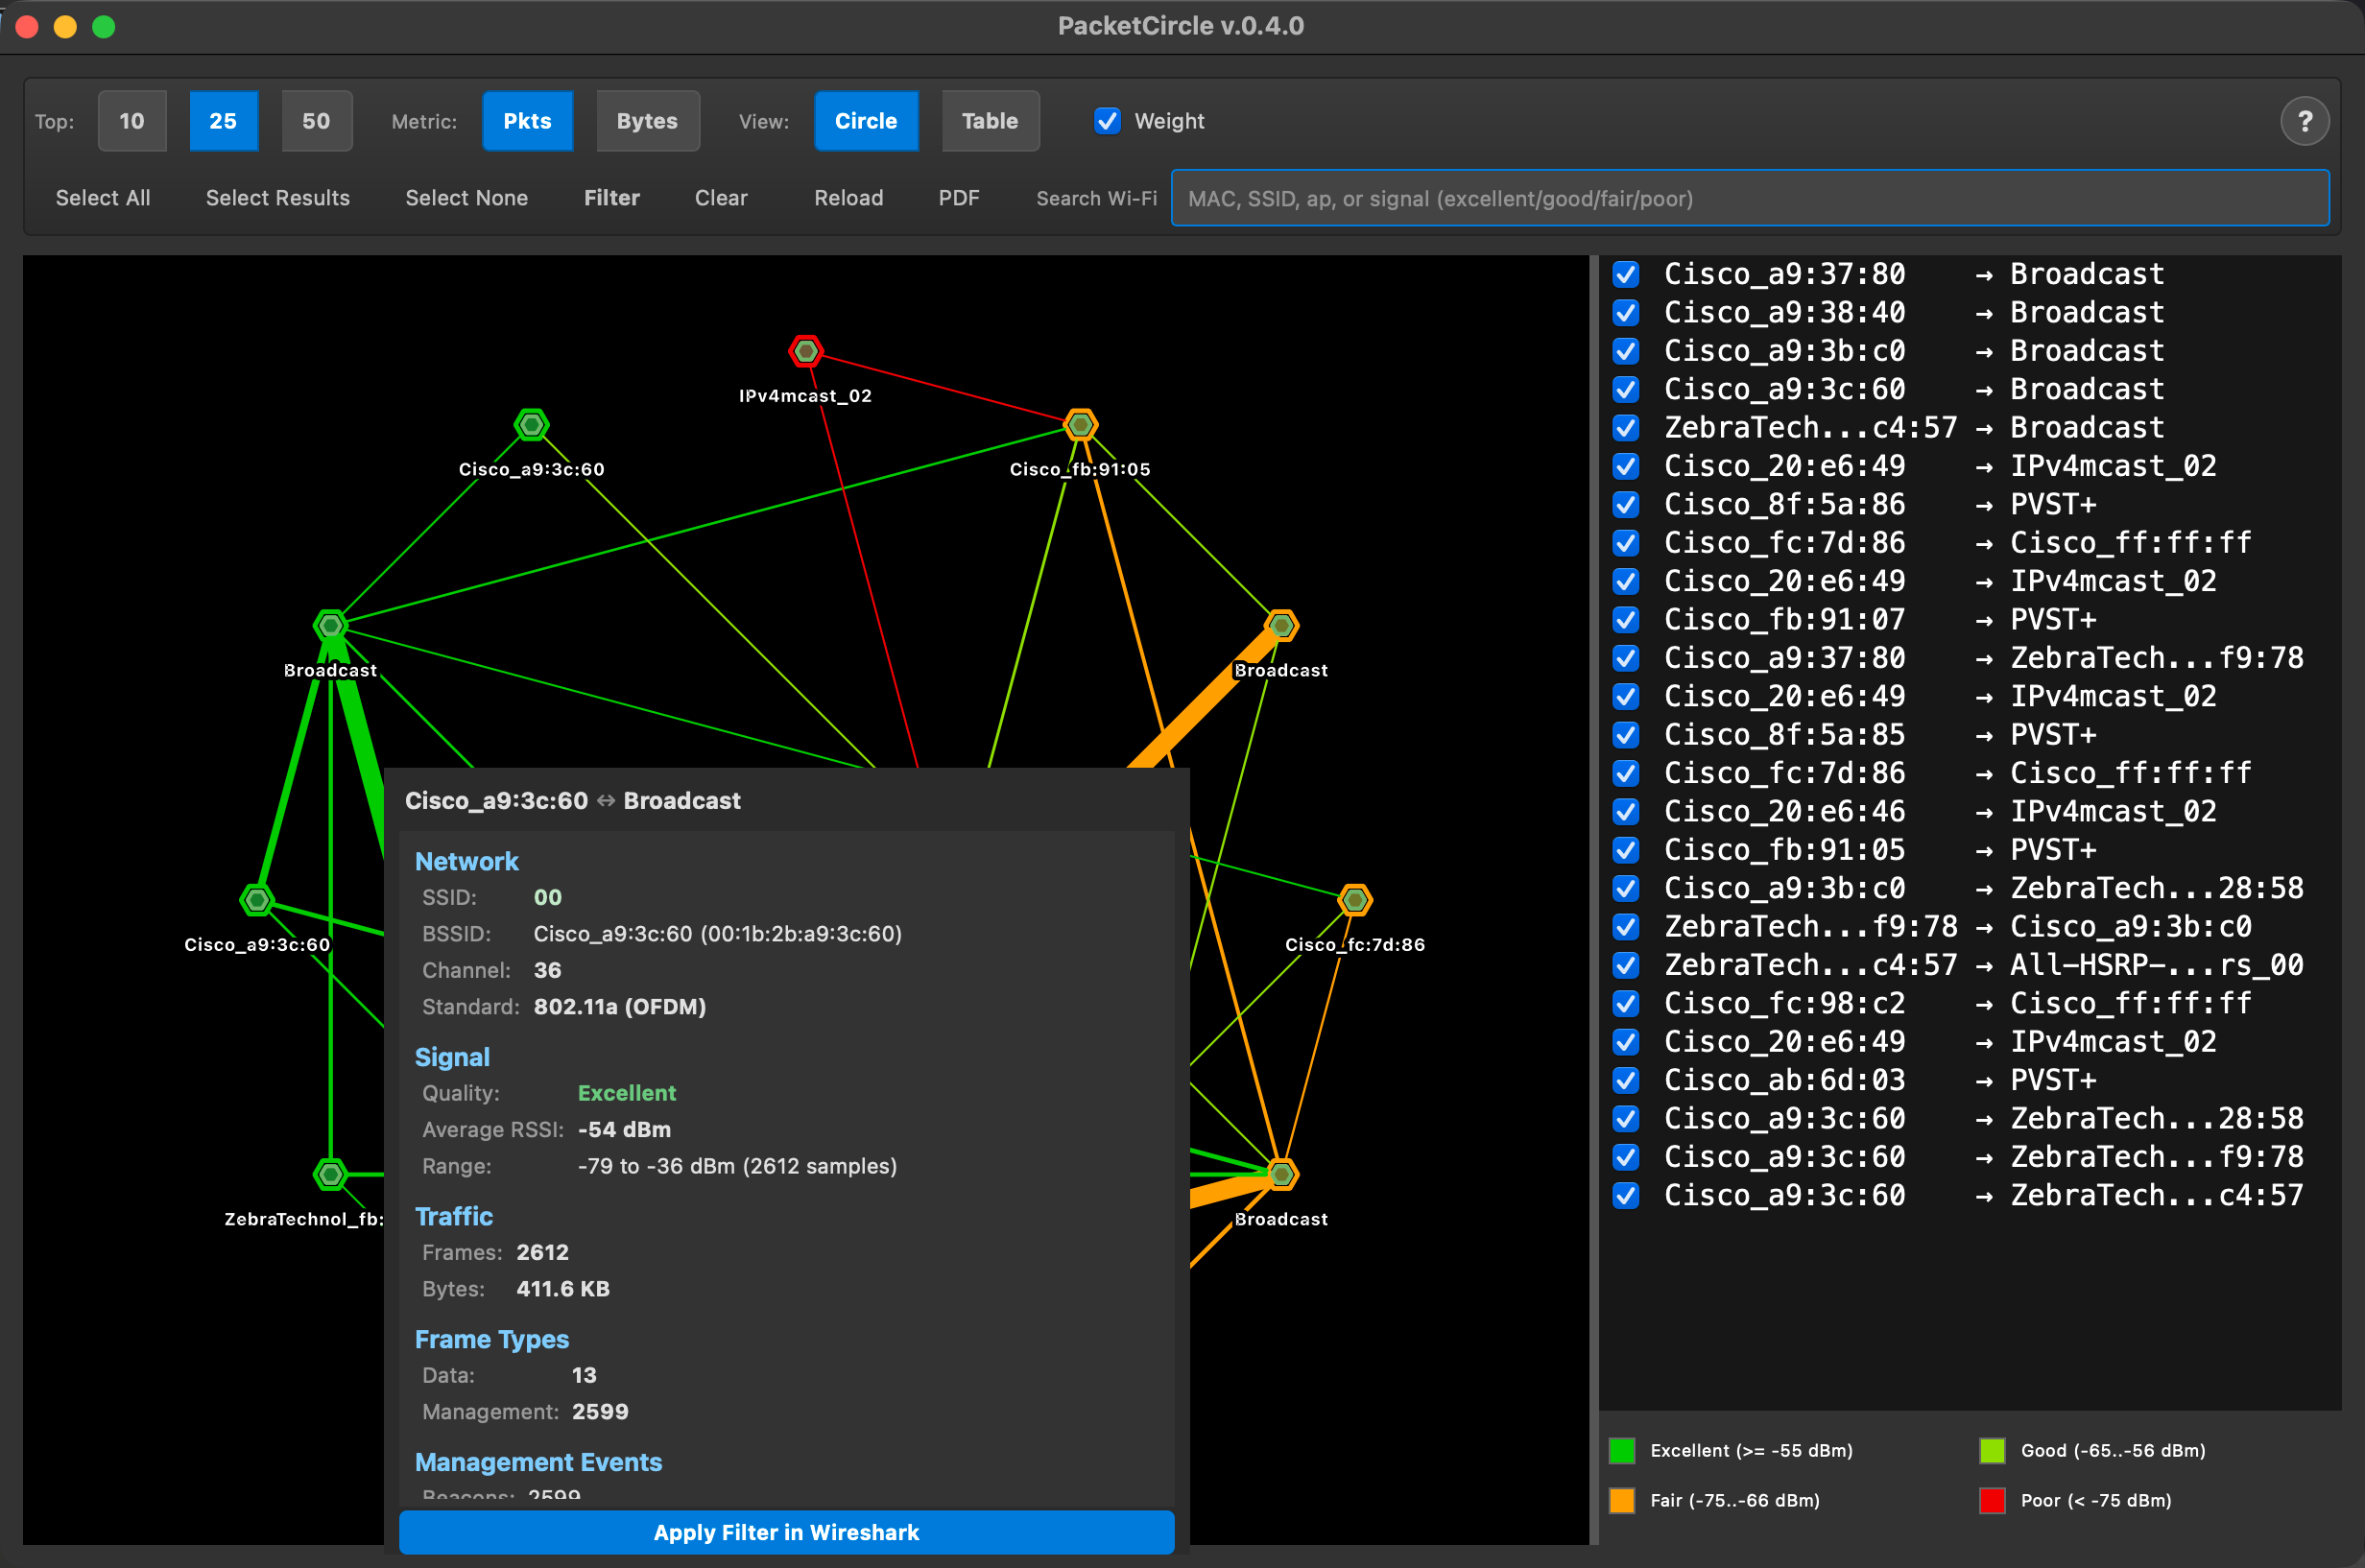
802.11 captures: RSSI-based color coding (green = excellent, red = poor). Click any node for signal stats, frame breakdown, and management events.
Connection popup & context menu
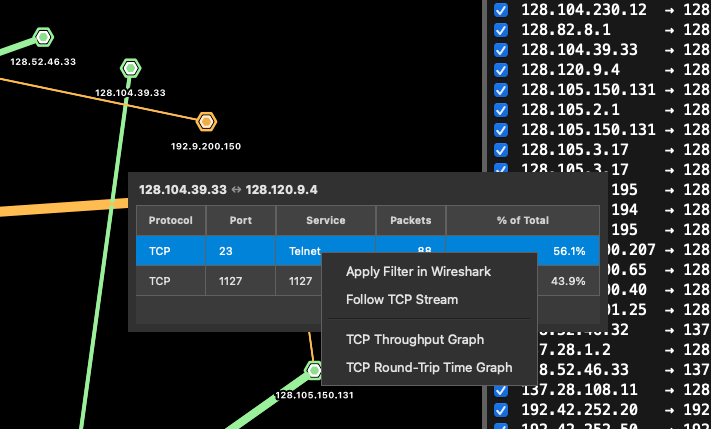
Click a line to see per-port details. Right-click to filter, follow a TCP stream, or open protocol info.
Experimental feature — v0.5.4: The Graph View showcases an interactive layout engine first introduced in v0.5.2 and refined since. This feature is experimental; behaviour and UI may change in future releases.
Graph view — Star layout with TCP Window analysis
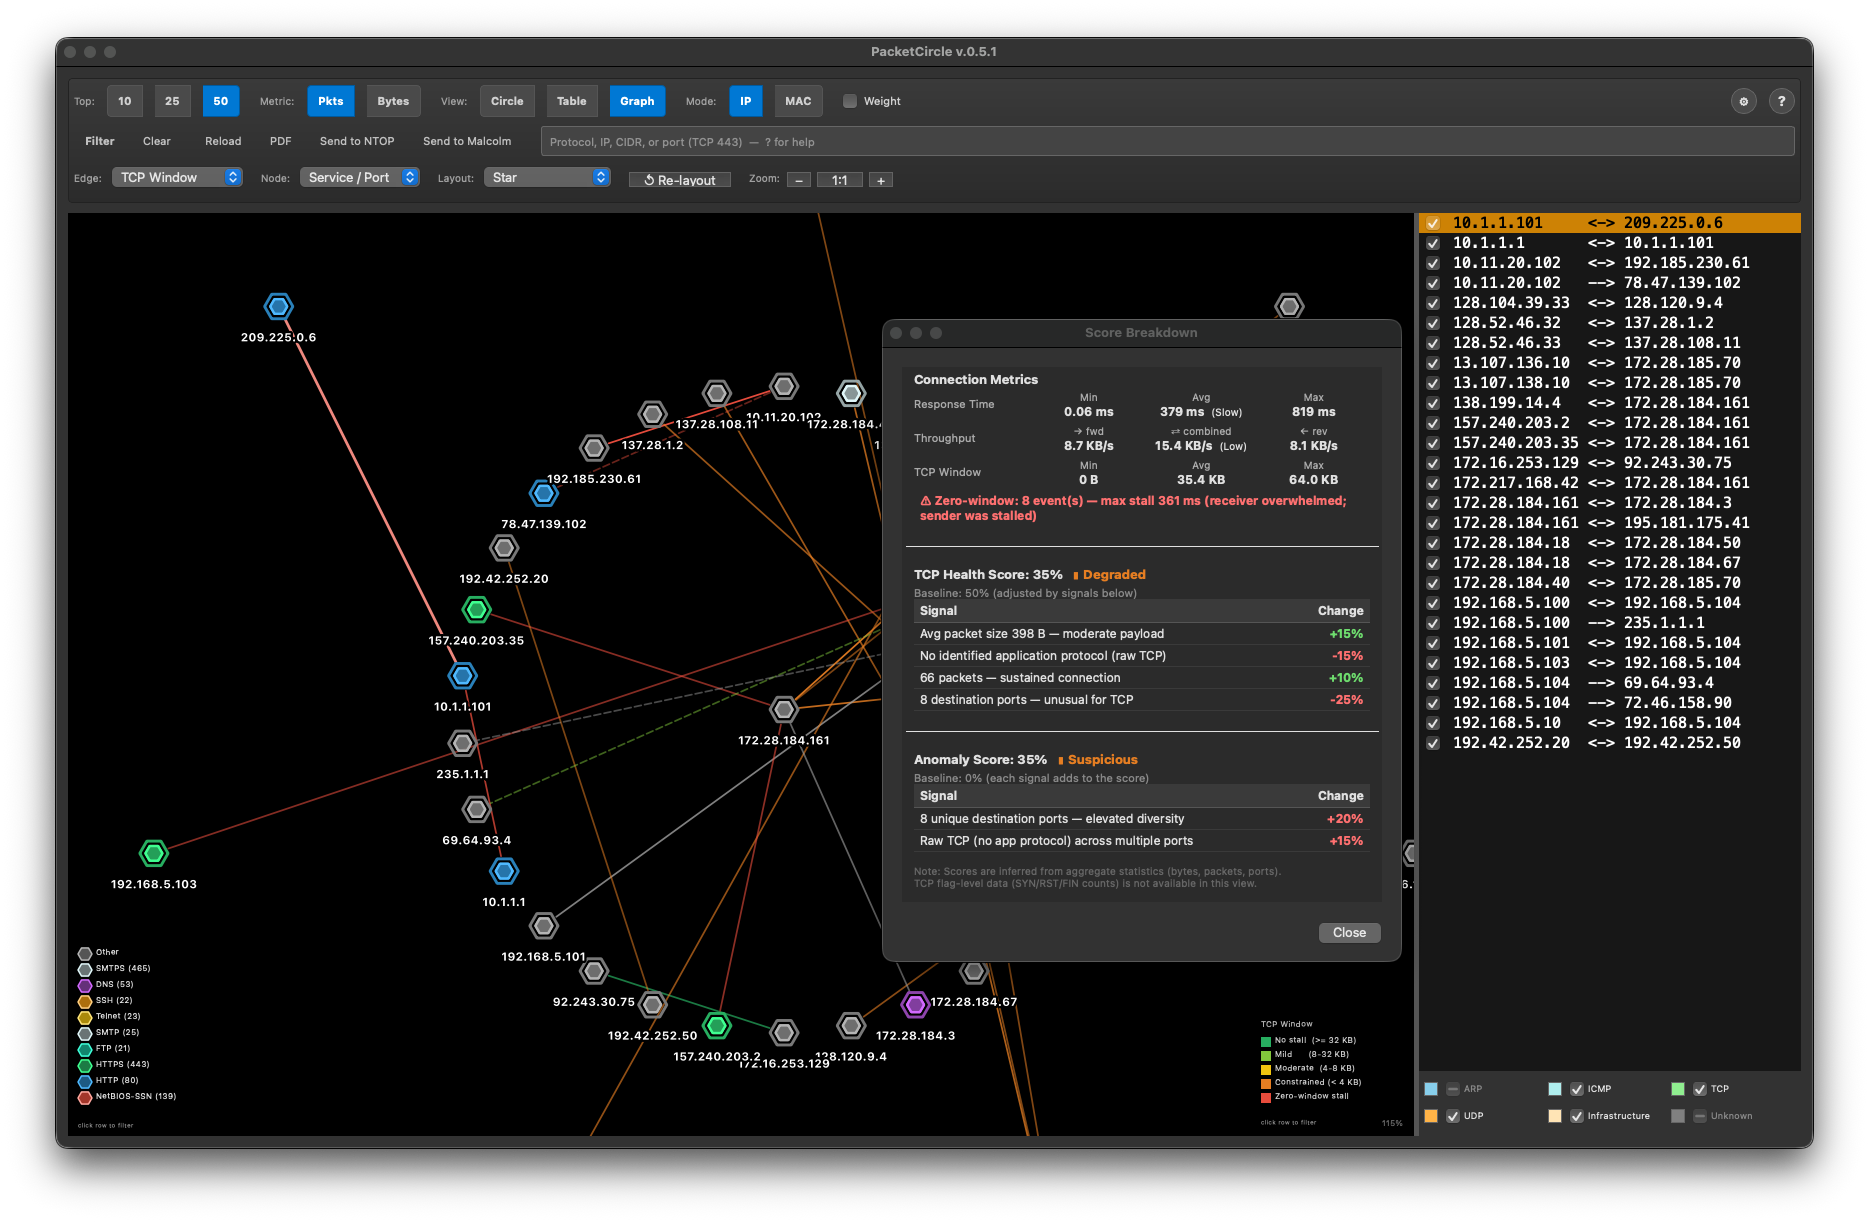
Star layout with TCP Window edge coloring: the busiest host anchors the centre; edge color reveals receiver-side buffer pressure — green = healthy, orange = constrained, red = zero-window stall.
Graph view — Hierarchical layout with Anomaly Score
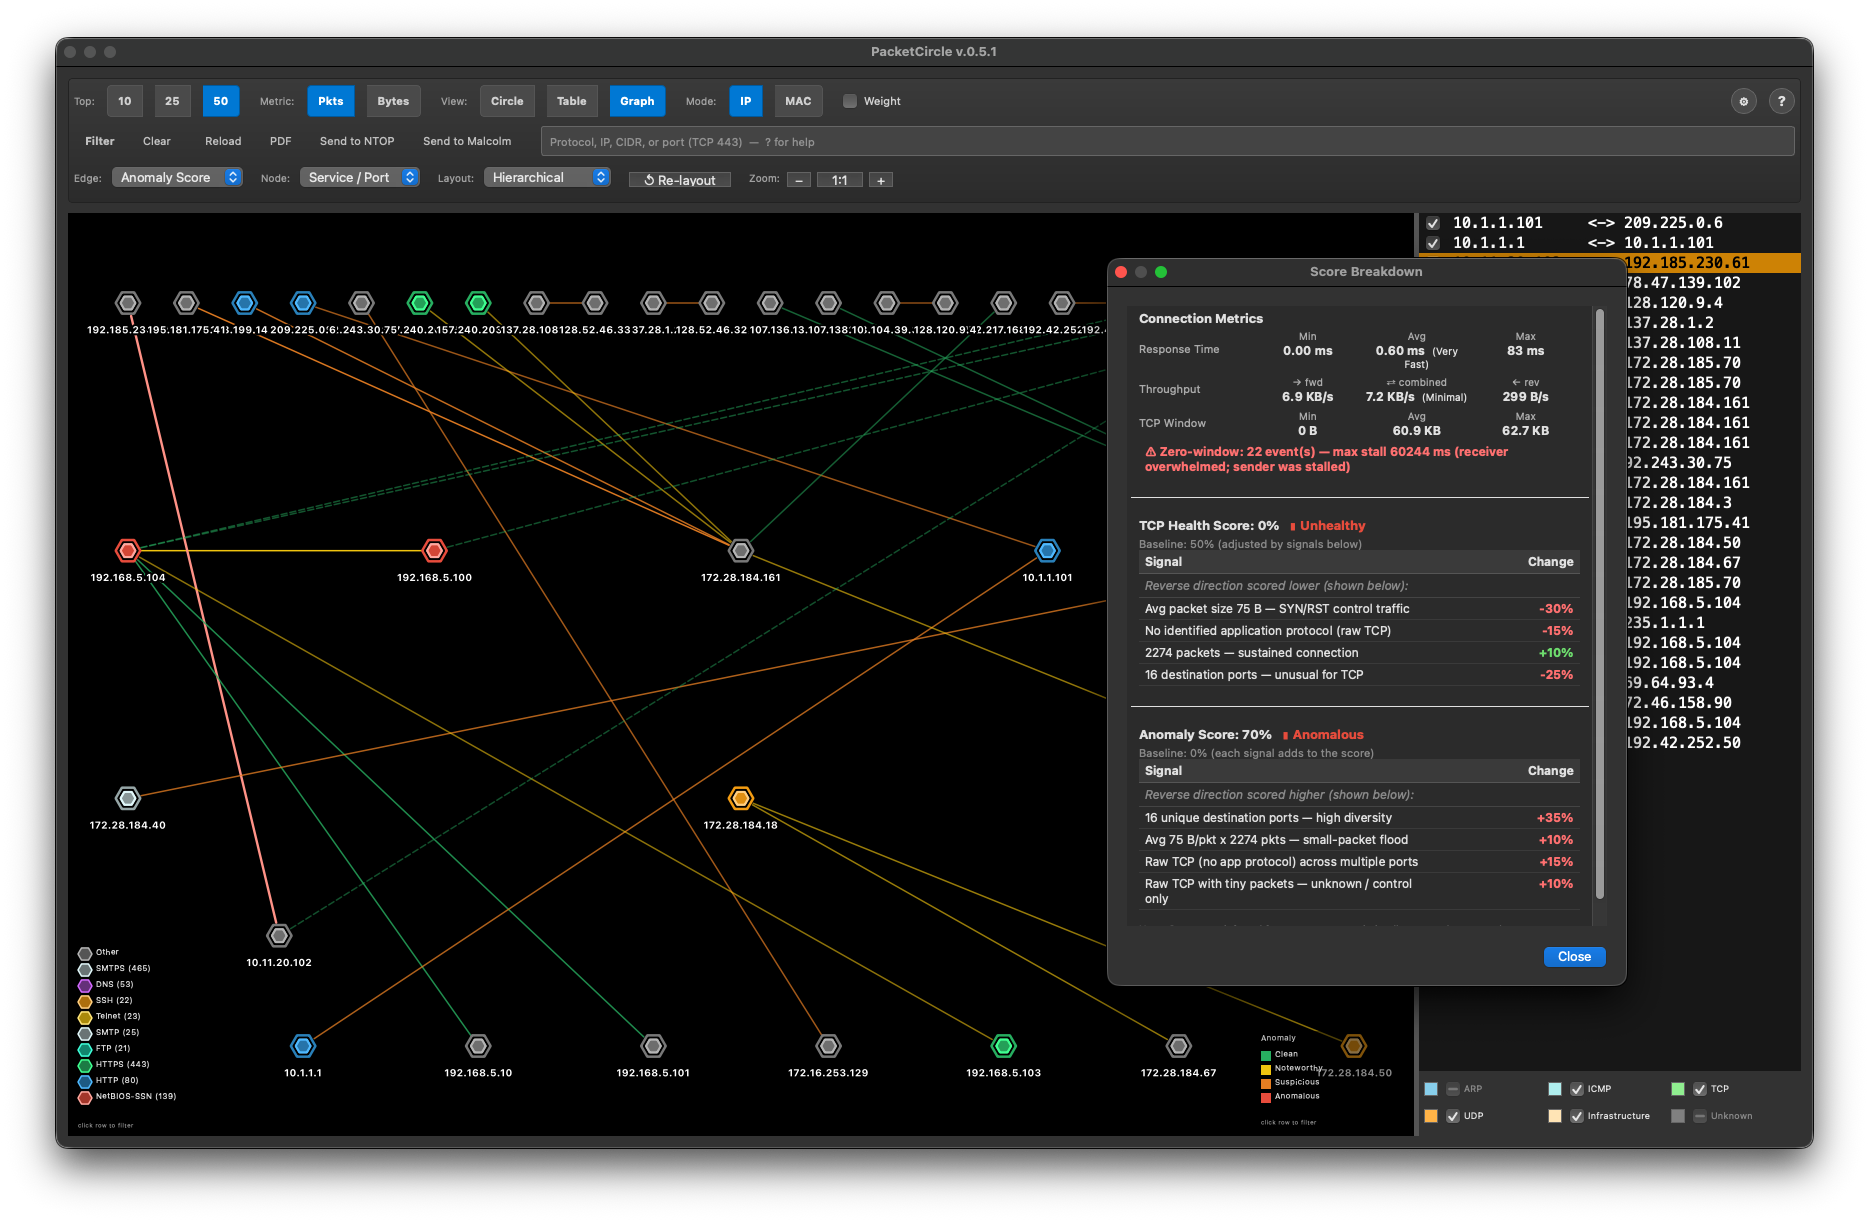
Hierarchical layout with Anomaly Score edge coloring: hosts are ranked top-to-bottom by traffic role; edge color surfaces port scans, flood patterns, and exfiltration — green = normal, red = high anomaly.
Graph view — Cluster layout by protocol / service
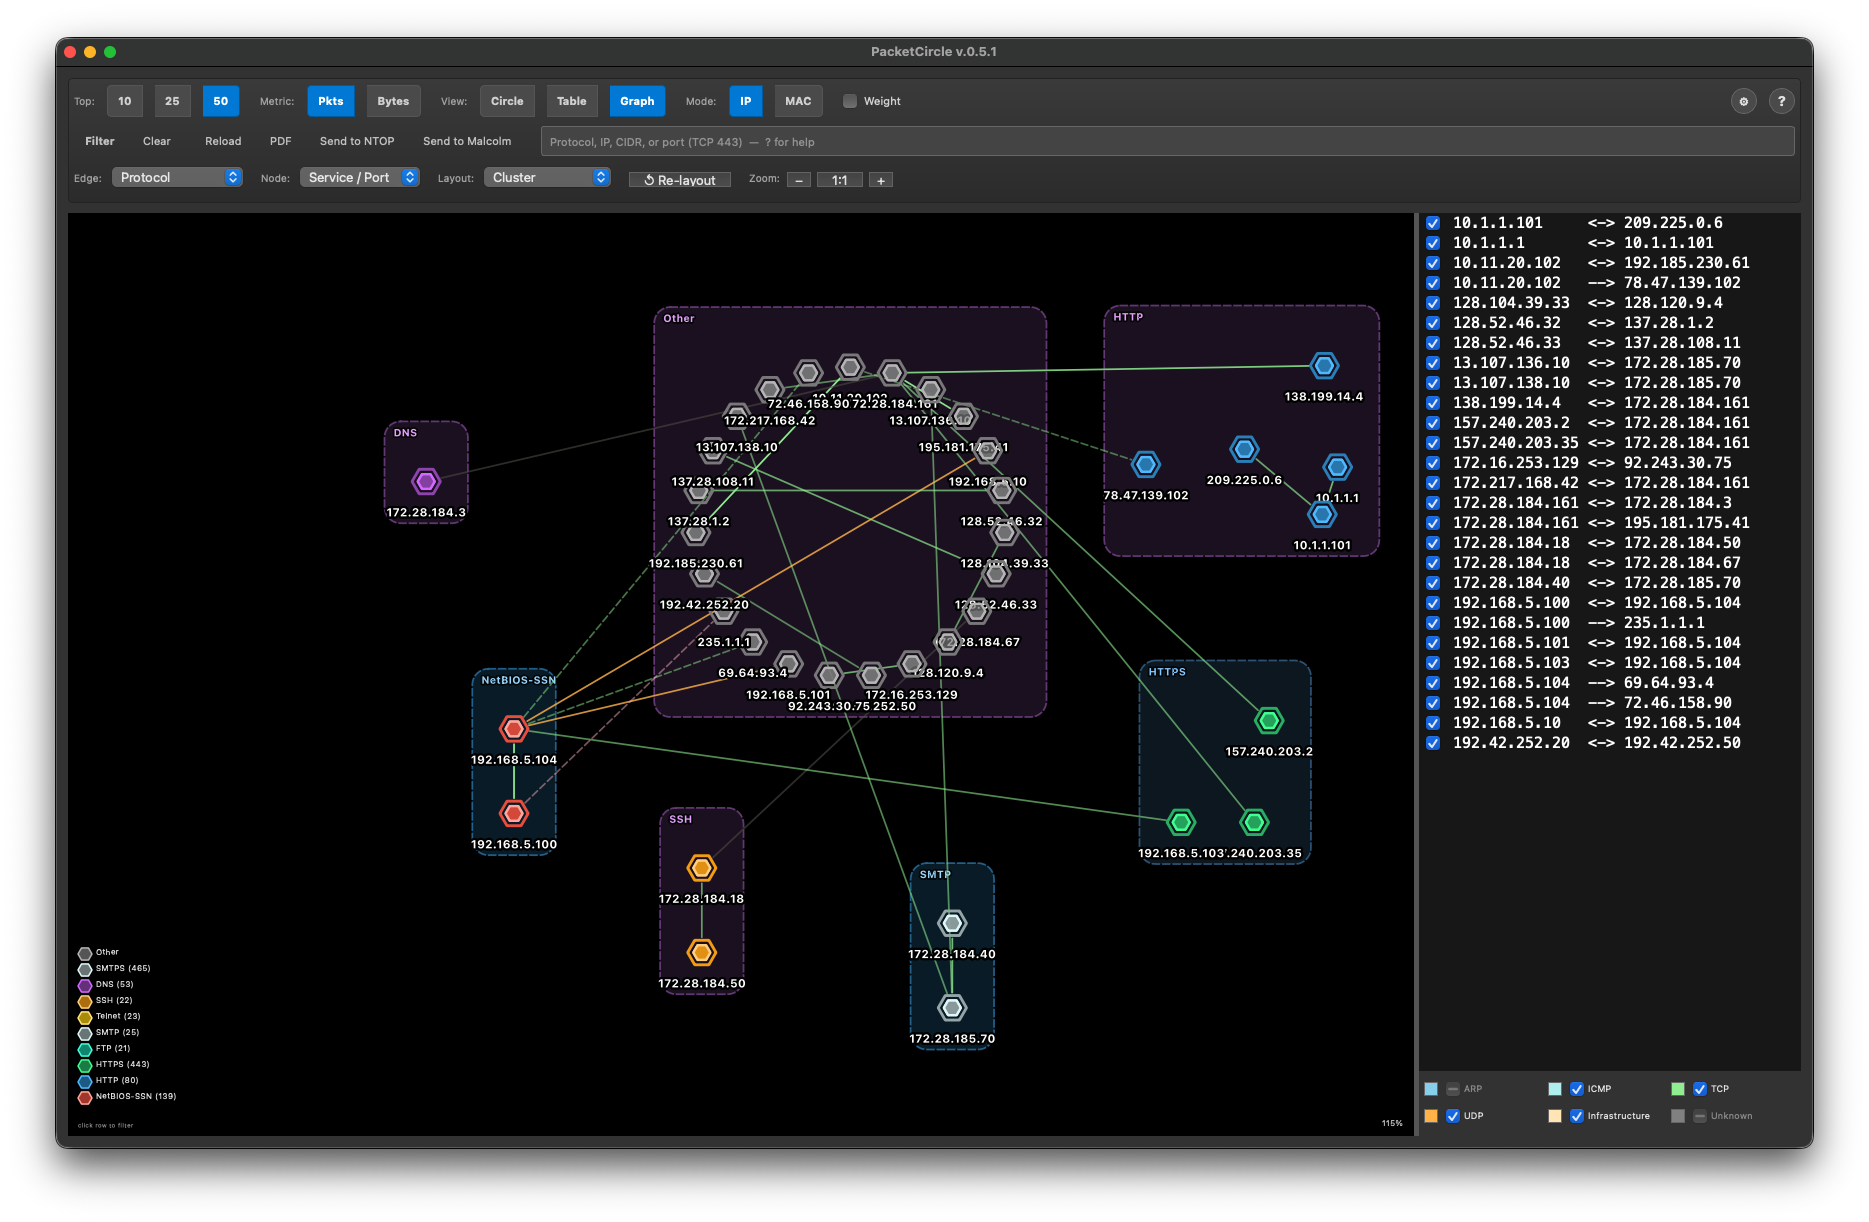
Cluster layout with Protocol/Service node coloring: hosts are grouped by the services they provide. Cross-cluster edges immediately reveal unexpected inter-service communication.
Graph view
The Graph view renders the same communication pairs as an interactive node-link topology diagram. Switch to it with the Graph button in the toolbar — or enable it first via the Experimental installer option.
Each host becomes a hexagonal node sized by traffic volume. Connections are edges colored by the selected mode:
| Edge color mode | What it shows |
|---|---|
| TCP Health | Green = healthy connection · Red = broken/refused/tiny-packet flood |
| Anomaly Score | Green = normal · Red = port scan, flood, or exfiltration pattern |
| Response Time | Green < 5 ms · Yellow 5–50 ms · Orange 200–500 ms · Red > 500 ms |
| Throughput | Blue < 10 KB/s → Red > 10 MB/s |
| TCP Window | Green = healthy buffer · Red = zero-window stalls |
| High Risk | Grey = safe · Yellow = SSH/SNMP · Orange = RDP/WinRM · Red = Telnet/FTP/VNC · Violet = VPN/TOR |
| Protocol | Same application protocol palette as Circle view |
Node color modes include Role (Internal/External/Broadcast), Service/Port, Protocol, and Function (Remote Access / Shell / Messaging / File Transfer).
8 layout algorithms: Force-directed · Star · Circular · Grid · Cluster · Concentric · Hierarchical · Radial — each optimized for a different analysis task. See graph-layout.md for details.
Clicking an edge in TCP Health or Anomaly Score mode opens a Score Breakdown showing every signal that contributed to the rating. For TCP connections, TCP Window statistics (min/max/avg window size, zero-window events) are also shown.
Graph view in Wi-Fi monitoring mode
In Wi-Fi monitor-mode captures (802.11 / radiotap), application-layer protocol data is not available — all traffic appears at the MAC layer. The Graph view adapts: edge colors reflect RSSI signal quality (green = excellent ≥ −55 dBm → red = poor < −75 dBm) and TCP Health / Anomaly Score modes are not applicable.
The Cluster layout remains fully useful in Wi-Fi mode — it groups nodes by their 802.11 role rather than subnet:
| Cluster group | Members |
|---|---|
| Access Points | BSSID nodes (infrastructure mode APs) |
| Data Stations | Client devices exchanging data frames |
| Management | Nodes seen only in management frames (probes, beacons, auth) |
| Broadcast / Multicast | Broadcast and multicast MAC addresses |
This makes it easy to spot rogue APs, unassociated clients, and management-frame floods even without any IP or protocol context.
Download & install
Option A — download the installer package (macOS and Windows)
⬇ Download installer.zip — contains macOS and Windows installers.
Linux users: the zip does not include the Linux binaries (too large). Use Option B (git clone) instead — it’s the preferred path for Linux anyway.
1. Download installer.zip and unzip it — you get an installer/ folder with both versions.
2. Open a terminal (macOS) or Command Prompt (Windows) and run the installer for your platform:
| Platform | Steps |
|---|---|
| macOS | cd installer/macos-universal → chmod +x install.sh → ./install.sh |
| Windows | Open Command Prompt → cd /d installer\windows-x86_64 → install.bat |
Option B — clone the repository (all platforms, recommended for Linux)
git clone https://github.com/netwho/PacketCircle.git
cd PacketCircle
Then run the installer for your platform from the installer/ directory:
| Platform | Steps |
|---|---|
| macOS | cd installer/macos-universal → chmod +x install.sh → ./install.sh |
| Linux | cd installer/linux-x86_64 → chmod +x install.sh → ./install.sh |
| Windows | Open Command Prompt → cd /d installer\windows-x86_64 → install.bat |
Installer options — Standard vs Experimental
All installers offer two versions and two feature sets:
Version: v0.5.4 (latest, default) — Wireshark-native UI refresh: pill toolbar, accent from host palette, restyled menus & legends, icon action bar, field-chip graph controls. Or v0.4.7 — stable legacy release.
Feature set (v0.5.4 only): Standard (default) — Circle view, Table view, Wi-Fi mode, 20+ protocol info dialogs, PDF reports, ntopng/Malcolm integration. Or Experimental — everything in Standard, plus the Graph View beta feature.
The default is v0.5.4 Standard. Just press Enter twice to install with no prompts.
All installers detect your Wireshark version, show any existing installation, and offer uninstall. Just run and follow the prompts.
→ Full installation guide, manual install, and uninstall: INSTALLATION.md
Supported platforms
| Wireshark version | macOS Universal | Windows x86_64 | Linux x86_64 |
|---|---|---|---|
| 4.6.x | ✓ | ✓ | ✓ |
| 4.4.x | — | — | ✓ |
| 4.2.x | — | — | ✓ |
| 4.0.x | — | — | ✓ ¹ |
¹ Wireshark 4.0.x on Linux requires Qt6 (libqt6widgets6). The installer detects this and offers to install it.
Documentation
| Document | Contents |
|---|---|
| INSTALLATION.md | Platform installers, manual install, prerequisites, uninstall |
| FEATURES.md | Every feature explained with use cases and controls reference |
| QUICKSTART.md | First-use walkthrough — up and running in 5 minutes |
| TROUBLESHOOTING.md | Common errors, platform-specific fixes, diagnostic tools |
| PROTOCOL-INFO.md | All 20+ protocol info dialogs — fields extracted, trigger ports |
| graph-scores.md | Graph view scoring algorithms — TCP Health, Anomaly Score, TCP Window, High Risk |
| graph-layout.md | All 8 graph layout algorithms — how each works and when to use it |
| CHANGELOG.md | Full version history |
License
GNU General Public License v2 — see LICENSE.
Acknowledgments
- Wireshark development team — for the outstanding dissector framework and plugin API that makes deep protocol inspection possible
- Wireshark community — for testing, feedback, and bug reports that shaped every release
- AI-assisted — yes (Claude by Anthropic) — used for build system automation, installer scripting, cross-platform compatibility, protocol info dialogs, and documentation
Built with care for the network analysis community — github.com/netwho/PacketCircle