




This Lua plugin correlates nmap Vulners and OpenVAS vulnerability scan results with captured network traffic, surfacing real-time vulnerability context directly in the Wireshark packet list — CVSS scores, CVE IDs, and service descriptions as custom columns, plus automatic color-coding of high-risk packets.
What it does
- Real-time detection of vulnerable services in network traffic
- CVSS integration — severity scores directly in packet columns
- CVE tracking — CVE identifiers for immediate research
- Service context — e.g. “Apache httpd 2.4.7”, “OpenSSH 6.6.1p1”
- Visual highlighting — automatic color-coding of high-risk packets
- Comprehensive reports — detailed vulnerability correlation reports
- Advanced filtering — Wireshark display filters extended with vulnerability data
Screenshots
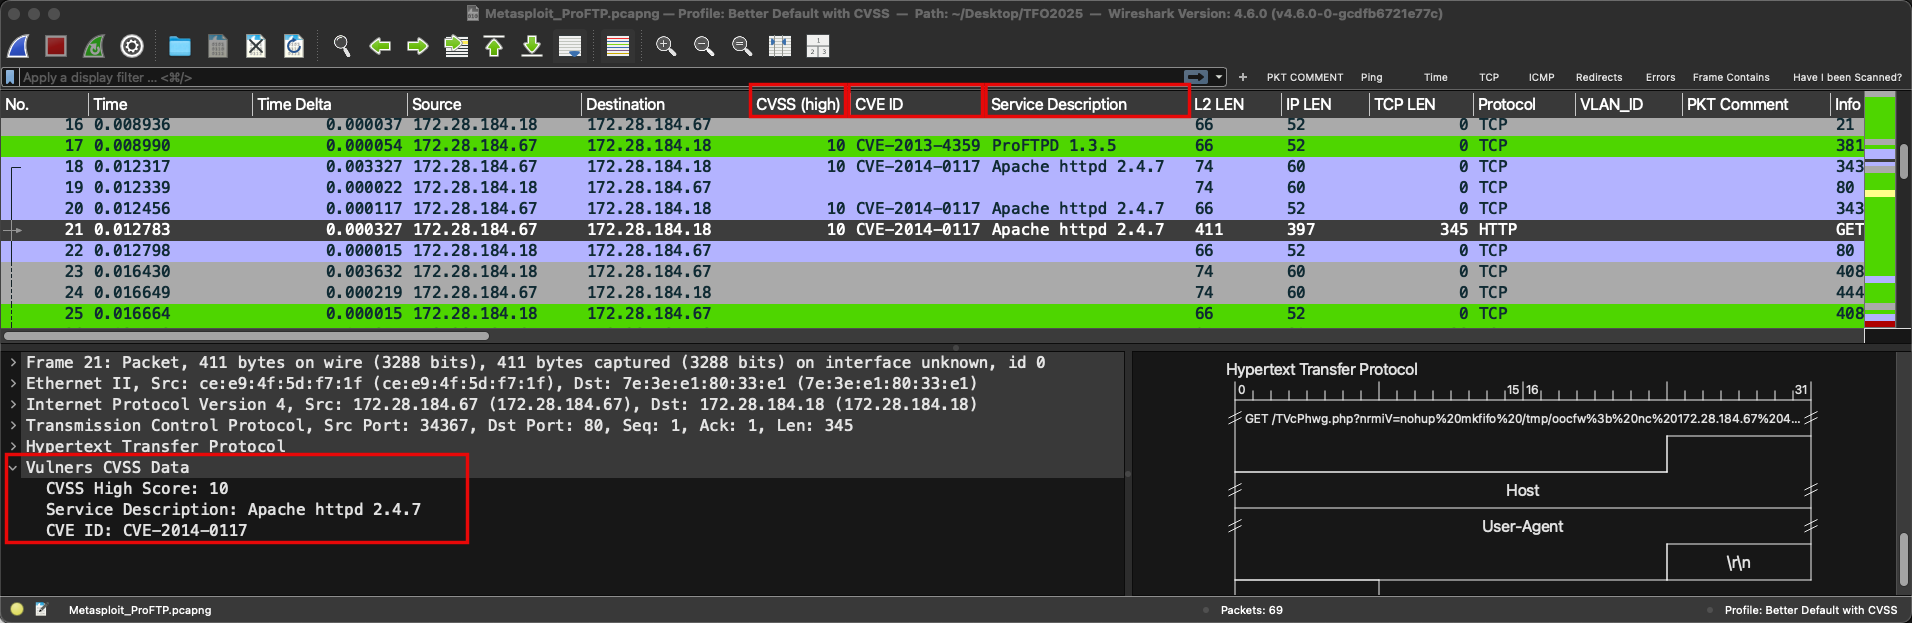
CVSS score, CVE ID, and service description columns in the packet list
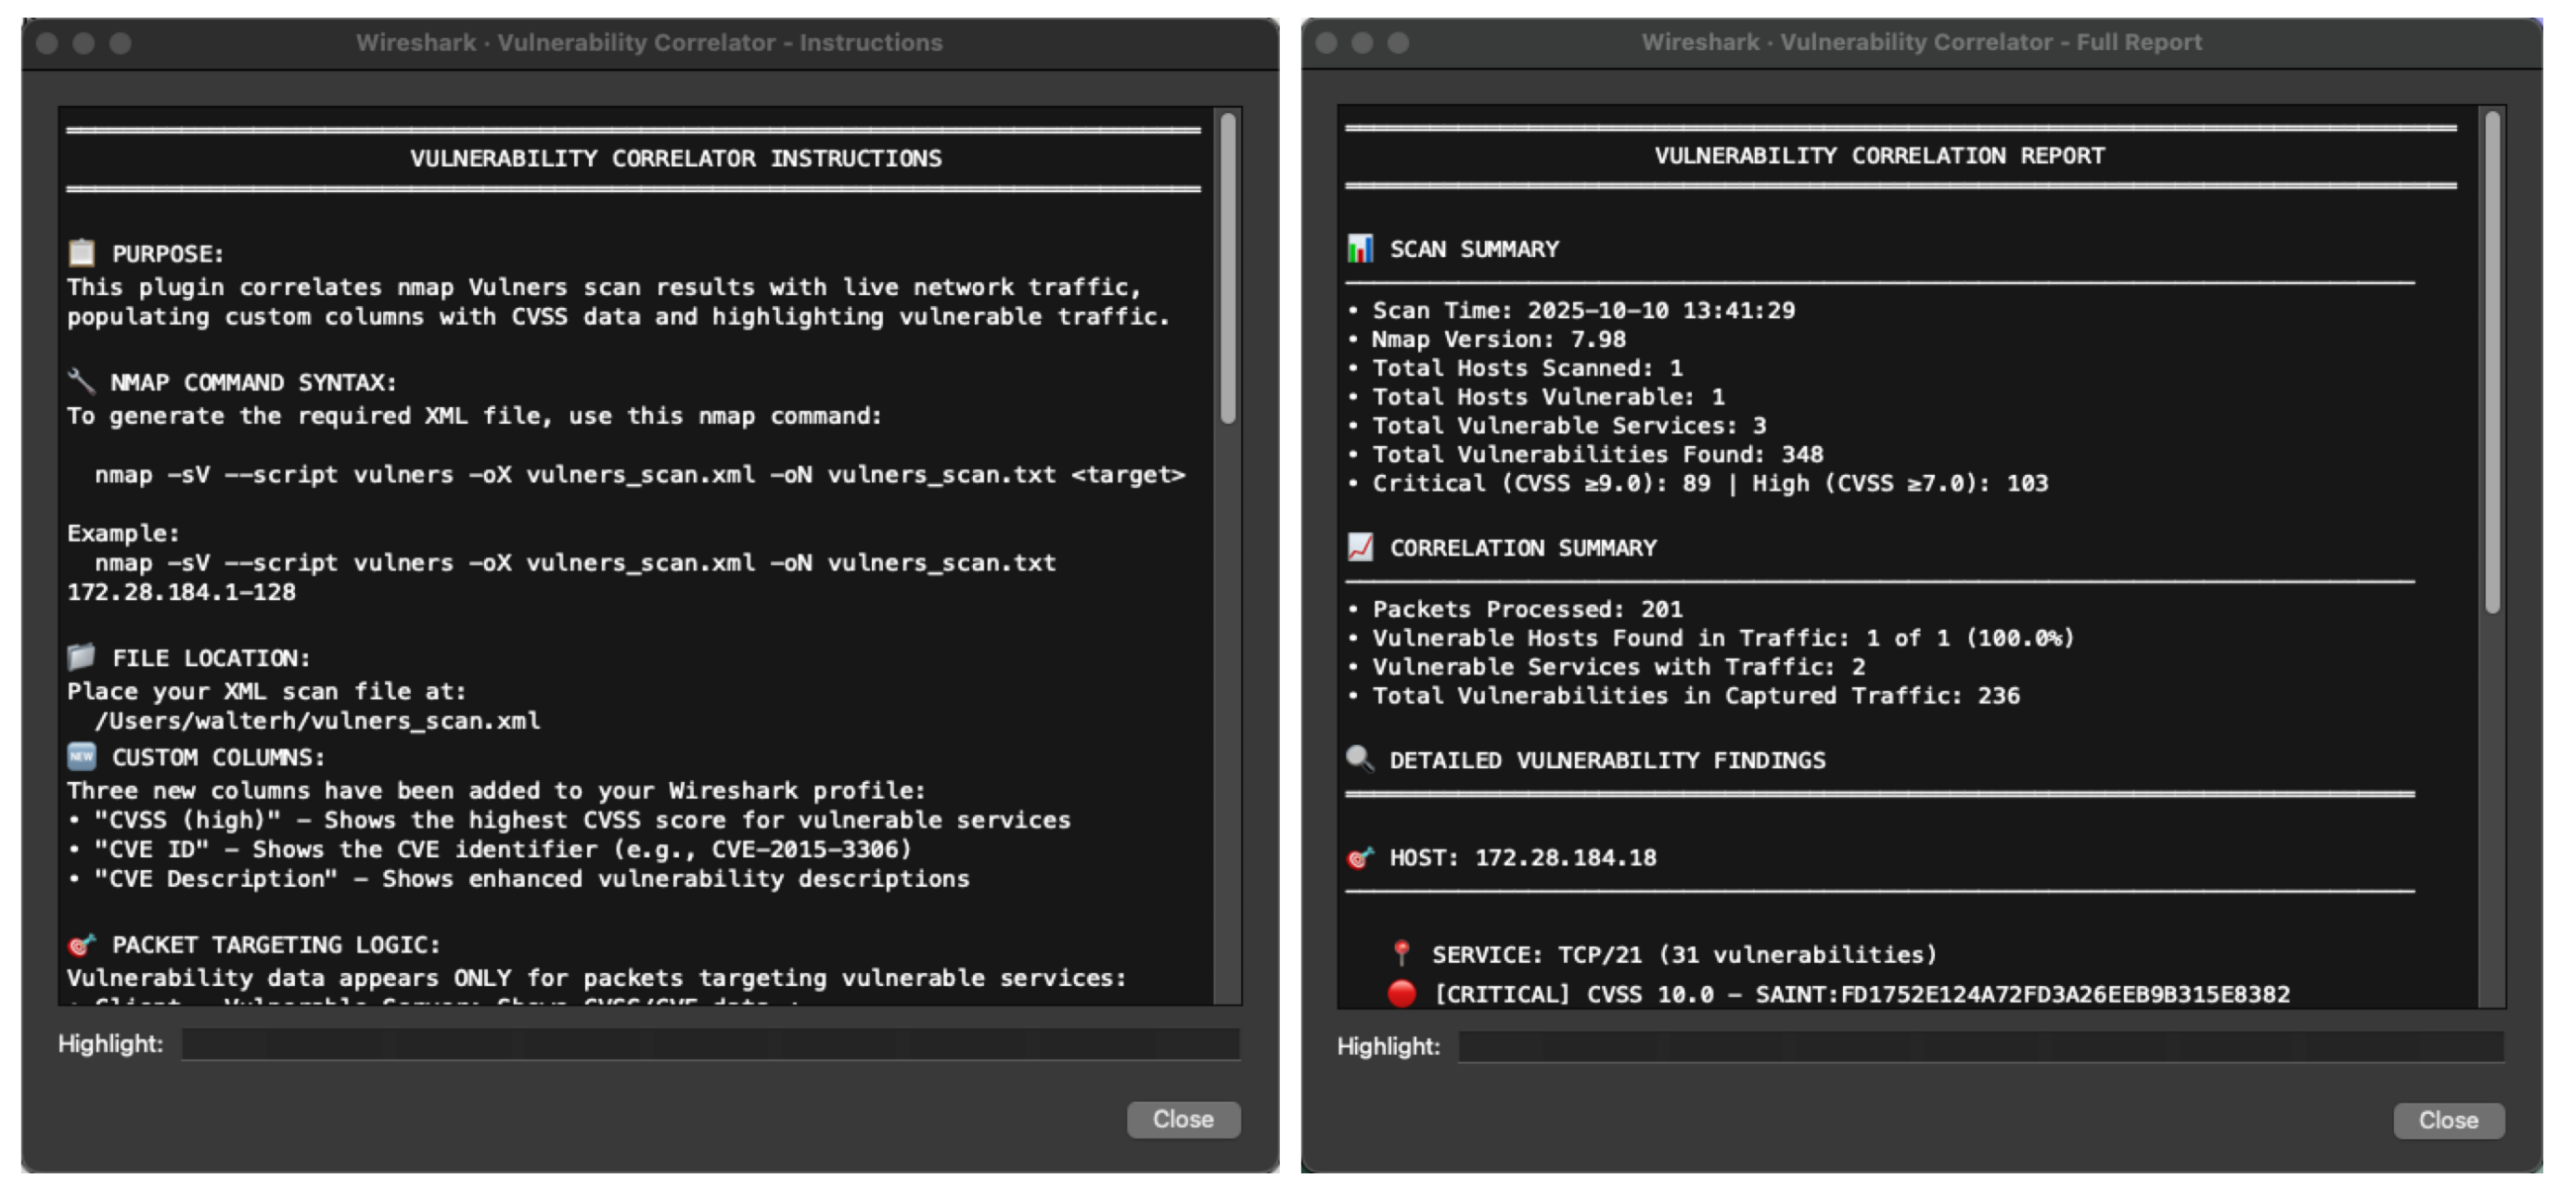
Instructions and correlation report screen (Tools → Vulnerability Correlator)
Quick demo
The repo ships sample data so you can see it working immediately: Metasploit_ProFTP.pcapng (a real capture with vulnerable ProFTP traffic) and vulners_scan.xml (nmap vulnerability scan results). The demo correlates ProFTP traffic with CVE-2015-3306 (CVSS 9.8), showing “ProFTPD 1.3.5” flagged red in the packet list. See samples/README.md for details.
Installation
| Platform | Steps |
|---|---|
| macOS | cd Mac-Installer && ./install_vulners_plugin.sh |
| Linux | cd Linux-Installer && chmod +x install_vulners_plugin_linux.sh && ./install_vulners_plugin_linux.sh |
| Windows | cd Windows-Installer; .\install_vulners_plugin_windows.ps1 |
All installers check prerequisites, install the plugin, create a “Vulnerability Analysis” Wireshark profile, pre-configure CVSS/CVE/Service columns, set up color filters for severity levels, and add useful filters to recent history.
Generating scan data
Option A — nmap Vulners:
nmap -sV --script vuln,vulners -oX ~/vulners_scan.xml 192.168.1.0/24
Option B — OpenVAS: run an OpenVAS scan, export to CSV, then convert with the included helper:
python3 helper/openvas_csv_to_xml.py openvas-export.csv ~/vulners_scan.xml
The plugin looks for ~/vulners_scan.xml (or %USERPROFILE%\vulners_scan.xml on Windows) automatically — no configuration needed if your scan lands there.
Display filter examples
| Filter | Matches |
|---|---|
vulners.cvss_high > 0 | Any vulnerable traffic |
vulners.cvss_high >= 7.0 | High severity |
vulners.cvss_high >= 9.0 | Critical severity |
vulners.cve_id == "CVE-2018-1312" | Specific CVE |
vulners.service_desc contains "Apache" | Apache services |
vulners.cvss_high >= 7.0 and tcp.port == 80 | High-risk HTTP traffic |
Field reference
| Field | Type | Description |
|---|---|---|
vulners.cvss_high | Float | CVSS score (0.0–10.0) |
vulners.cve_id | String | CVE identifier |
vulners.service_desc | String | Service description from the scan |
Visual analysis
🔴 Red background: high severity (CVSS ≥ 7.0). 🟡 Yellow background: medium severity (CVSS 4.0–6.9). 🟢 Green background: low severity (CVSS 0.1–3.9).
Requirements
- Wireshark 4.0+
- nmap with the Vulners script, or OpenVAS (via the included CSV→XML converter)
- A packet capture (pcap/pcapng) and a vulnerability scan result (XML)
License
GNU General Public License v2.0 — see LICENSE.