PacketCircle macOS — User Manual
The desktop half of PacketCircle Native: conversation topology, live capture, native Decode, and one-click handoff to Wireshark — a SwiftUI app on a Rust analysis core.
1. Background and motivation
PacketCircle macOS is the desktop half of PacketCircle Native — a Swift/SwiftUI rewrite of the ideas behind the original open-source PacketCircle Wireshark plugin. It shares PacketCircleCore with the iOS app: open a PCAP/PCAPNG (or capture live), see who’s talking to whom, spot rough TCP health, and drill into a conversation — all without shipping Wireshark or a GPL dissection stack.
What it is
A capture visualizer built around conversation topology (the circle), a sortable pair table, rate/quality gauges, and a native packet Decode window. Desktop-native: Decode opens in its own window, live capture from local interfaces, replay of a capture at original timing, and one-click handoff to Wireshark when you need its full dissector depth. Free of charge and unlimited — no ads, no in-app purchases, no telemetry. Not open source (yet): built with the GPL in mind, but not published under GPL-2.0 today after the complete re-architecture. The sources will be released as soon as I feel comfortable; if your organization wants to see them before that, just ask.
On macOS 1.2.x: Expert Alerts, Compare Conversations, Sanitize Capture, Generate Report, Map, and tunable Settings — see §16, below.
On macOS 1.3.x: the analysis now runs on a Rust core shared with the Linux and Windows apps — a 600 MB capture with 1.2 million frames is analyzed in 5 seconds instead of 1 minute 7 seconds. New: the Expert Alerts page, clickable Gauges, a redesigned Connection details header, Sanitize on save and a report logo — see §17. The 1.3.x DMG is built for Apple silicon and needs macOS 14 or later. Looking for Linux or Windows? See the Linux and Windows manual.
What it is not
PacketCircle is not a desktop Wireshark. It contains no open-source Wireshark / libwireshark dissection. Decode is native and best-effort: solid IP/TCP/UDP detail and some application-layer recognition, not dissector-for-dissector parity with Wireshark. TCP session-quality grades are a native heuristic — explicitly labeled “not Wireshark tcp.analysis” wherever shown. When you need full dissector depth, Open in Wireshark hands the capture off with the current display filter already copied.
2. Getting started
| Step | Action |
|---|---|
| 1 | Open PacketCircle.app (Tech Preview DMG). |
| 2 | Open Capture… (⌘O) to load a PCAP/PCAPNG, or Demo Mode to just look around. |
| 3 | For live traffic, Interfaces… (⇧⌘I) instead. |
| 4 | Explore Circle → Table → Gauges from the view-options bar; open Decode (⇧⌘D) for packet-level detail. |
Before anything is loaded, the main window offers the same four entry points directly on the canvas:
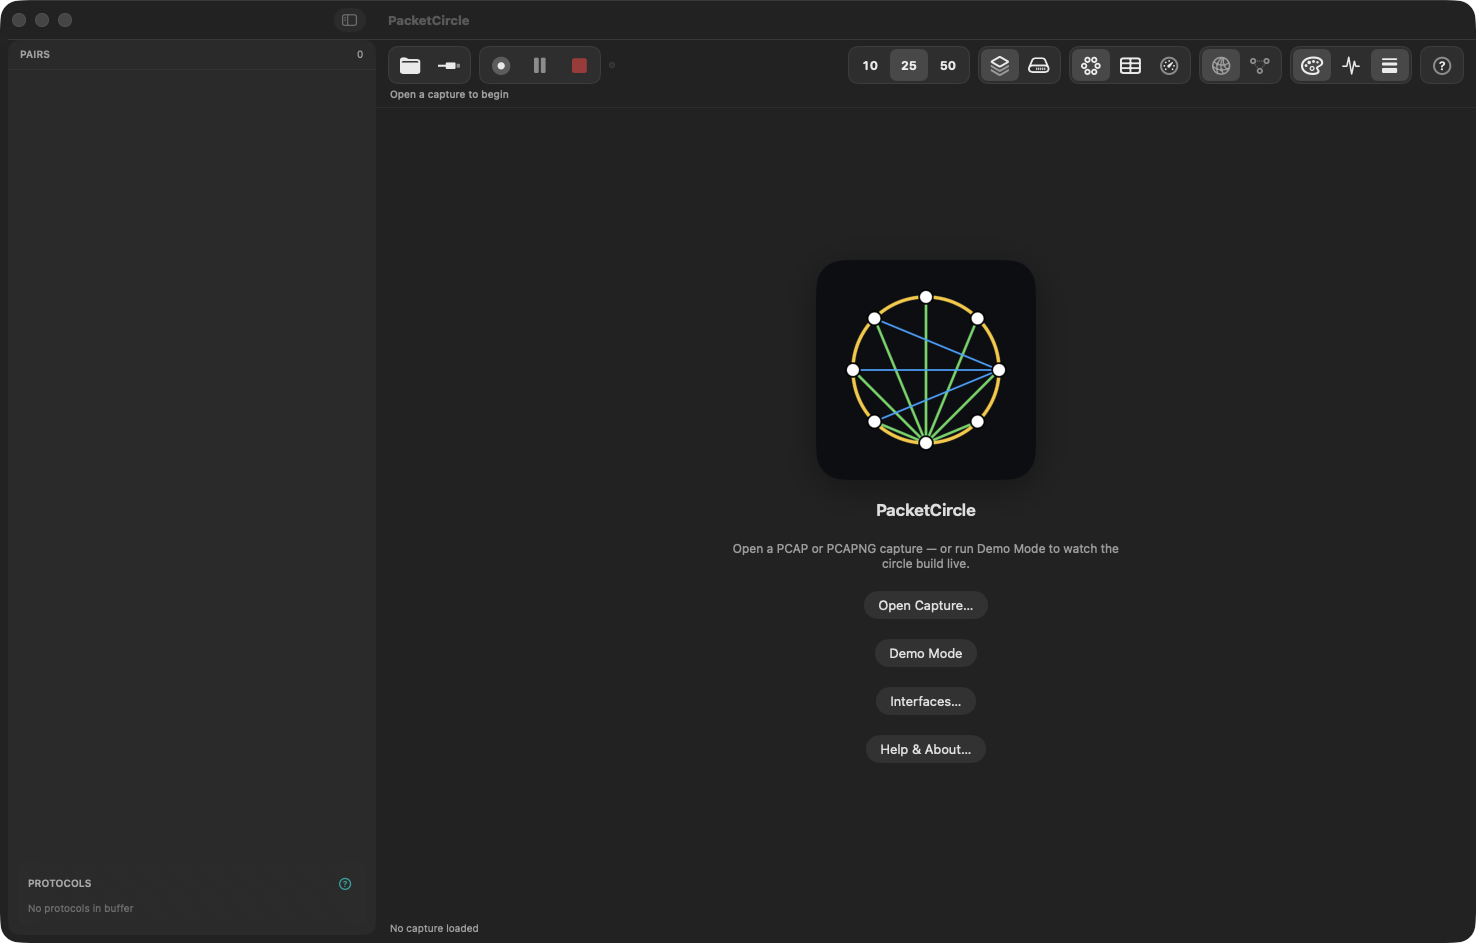
Empty state — Open Capture, Interfaces, Demo Mode, and Replay, all one click away.
3. Main window layout
The window is a single split view: a sidebar (pair list + protocol legend) on the left, and the active display mode (Circle / Table / Gauges) on the right, with a two-row toolbar above.
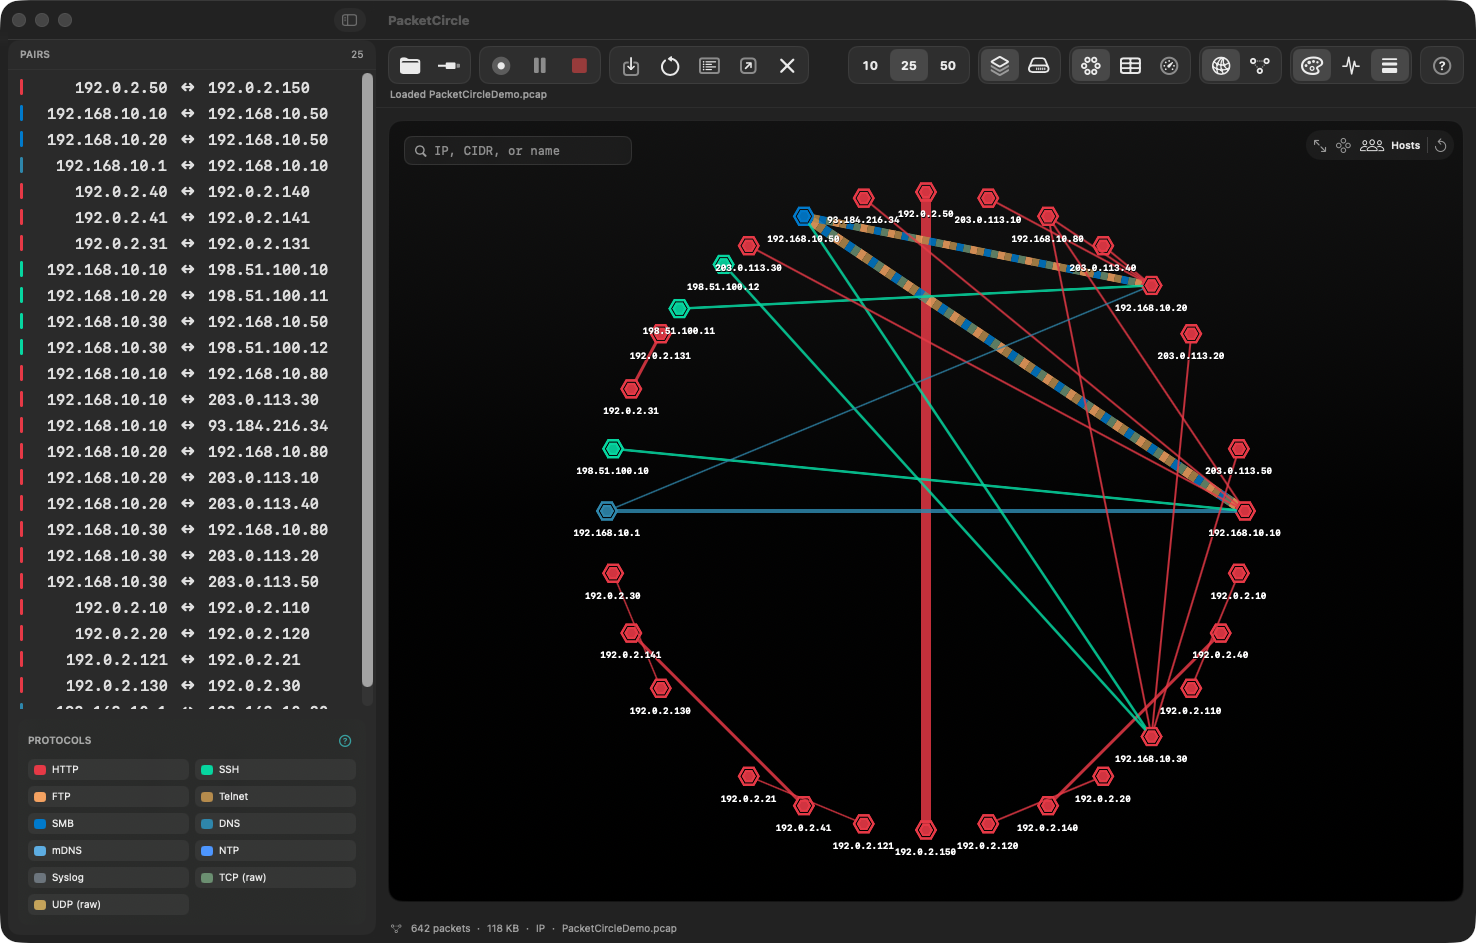
Circle view with Demo Mode loaded. Loading a capture adds a second toolbar row for export, reset, report, external-open, and close.
The protocol legend at the bottom of the sidebar lists every protocol seen in the capture in two columns; click one to filter, and where the list is long a Show all link expands it. A disclosure triangle folds the legend away and remembers its state. Hovering a pair row or a chord highlights that chord and dims the others.
3.1 Primary toolbar
| Control | Shortcut | Role |
|---|---|---|
| Open | ⌘O | Open a PCAP/PCAPNG file |
| Interfaces | ⇧⌘I | Choose a local interface and start a live capture |
| Transport controls | — | Start / pause / resume / stop the current live capture or replay |
| Export | ⌘S | Save Capture As… |
| Reset | — | Clears selection, protocol filter, and manual direction overrides. Fills accent-orange when there’s something to clear, disabled otherwise. |
| Report | — | Generate a session report |
| Open externally | — | Hand the capture off (e.g. to Wireshark) |
| Close | ⇧⌘W | Close Capture — back to the start screen (circled ×; disabled when nothing is open) |
| Info | — | Capture details — or About when nothing is open (always enabled) |
| Help | — | Opens Help (right end of the toolbar) |
| Decode | ⇧⌘D | Open the Decode window |
3.2 View options bar
| Control | Options | Role |
|---|---|---|
| Top N | 10 / 25 / 50 | How many conversations the Circle shows |
| Layout mode | layers / cloud icons | Display grouping |
| Display mode | Circle / Table / Gauges / Map / Expert Alerts | Switch the main canvas |
| Address mode | globe / node-graph icons | IP vs MAC pairing |
| Edge color | palette icon | Color arcs by protocol category, or by native TCP session-quality grade |
| Line weight | waveform icon | Toggle traffic-volume line thickness |
3.3 Sidebar
The pair list mirrors what’s on the circle, filtered by the protocol legend. Selecting a row highlights it orange and highlights the matching arc on the circle.
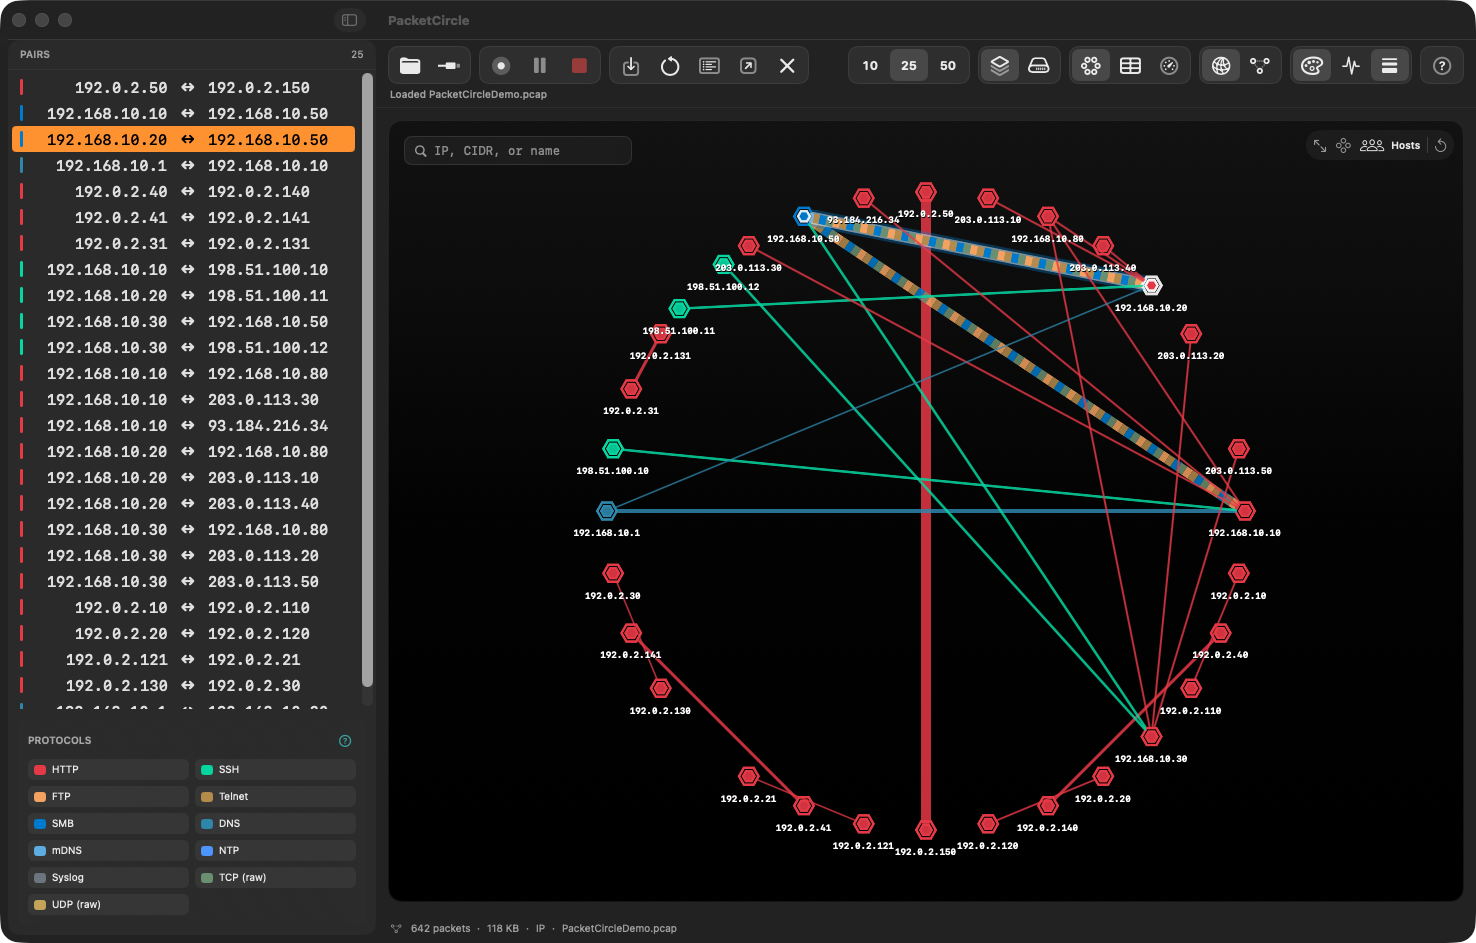
Selecting a conversation highlights both the sidebar row and the matching arc.
4. Circle view
Hosts sit on a ring as hexagonal nodes; each conversation is an arc, colored and weighted per the view options above. One-way traffic is dotted with an arrowhead; two-way traffic is a solid line.
Gestures
| Gesture | Effect |
|---|---|
| Pinch / scroll | Zoom |
| Drag | Pan |
| Click an arc | Select the conversation — opens the connection popup |
| Click a node | Select that host’s busiest conversation |
| Right-click an arc | Context menu |
| Right-click a node | Restart capture · host · Copy BPF · host · Select station |
Floating canvas controls (top-right): a search field (IP, CIDR, or name), fit-to-screen, rearrange, a Hosts toggle, and Reset.
4.1 Right-click on an arc (conversation)
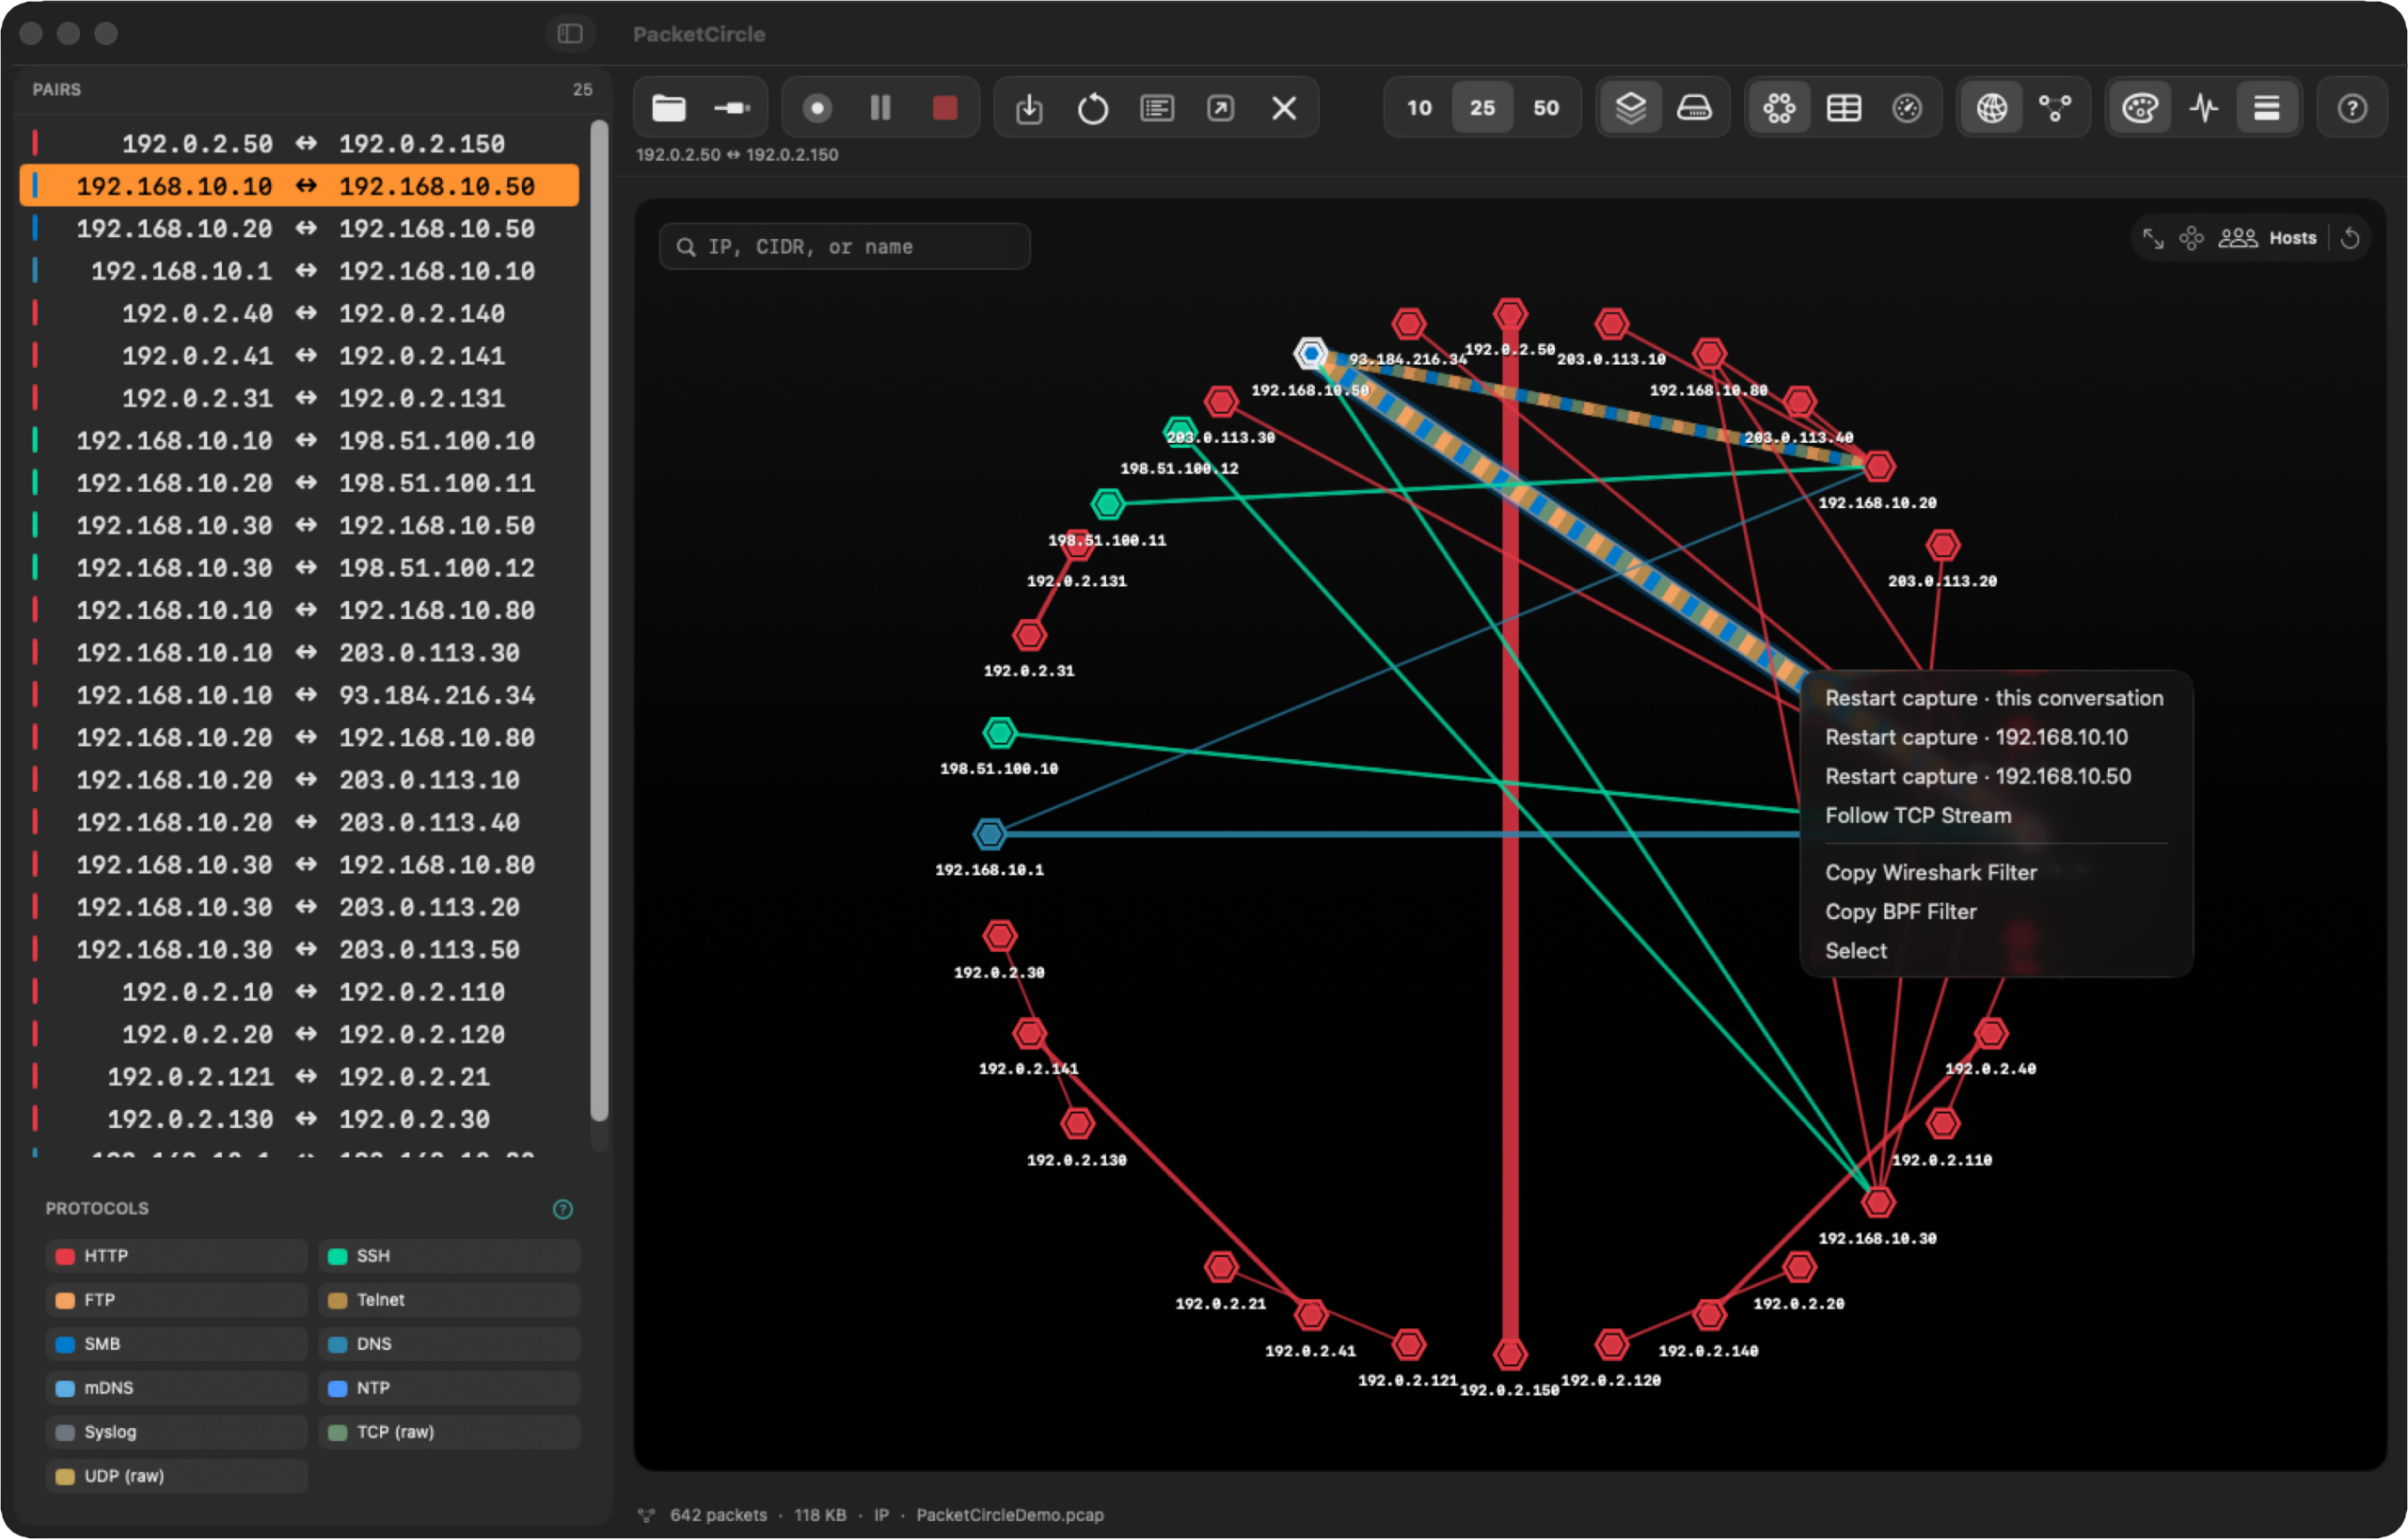
Restart capture · this conversation / · src / · dst · Follow TCP Stream · Copy Wireshark Filter · Copy BPF Filter · Select.
5. Connection details popup
Selecting a conversation opens a floating popup with a real triage panel for that pair — not just an address summary.
Since 1.3.1 the header shows endpoint blocks and stat chips, and application messages are drawn as a sequence diagram — see §17.4.
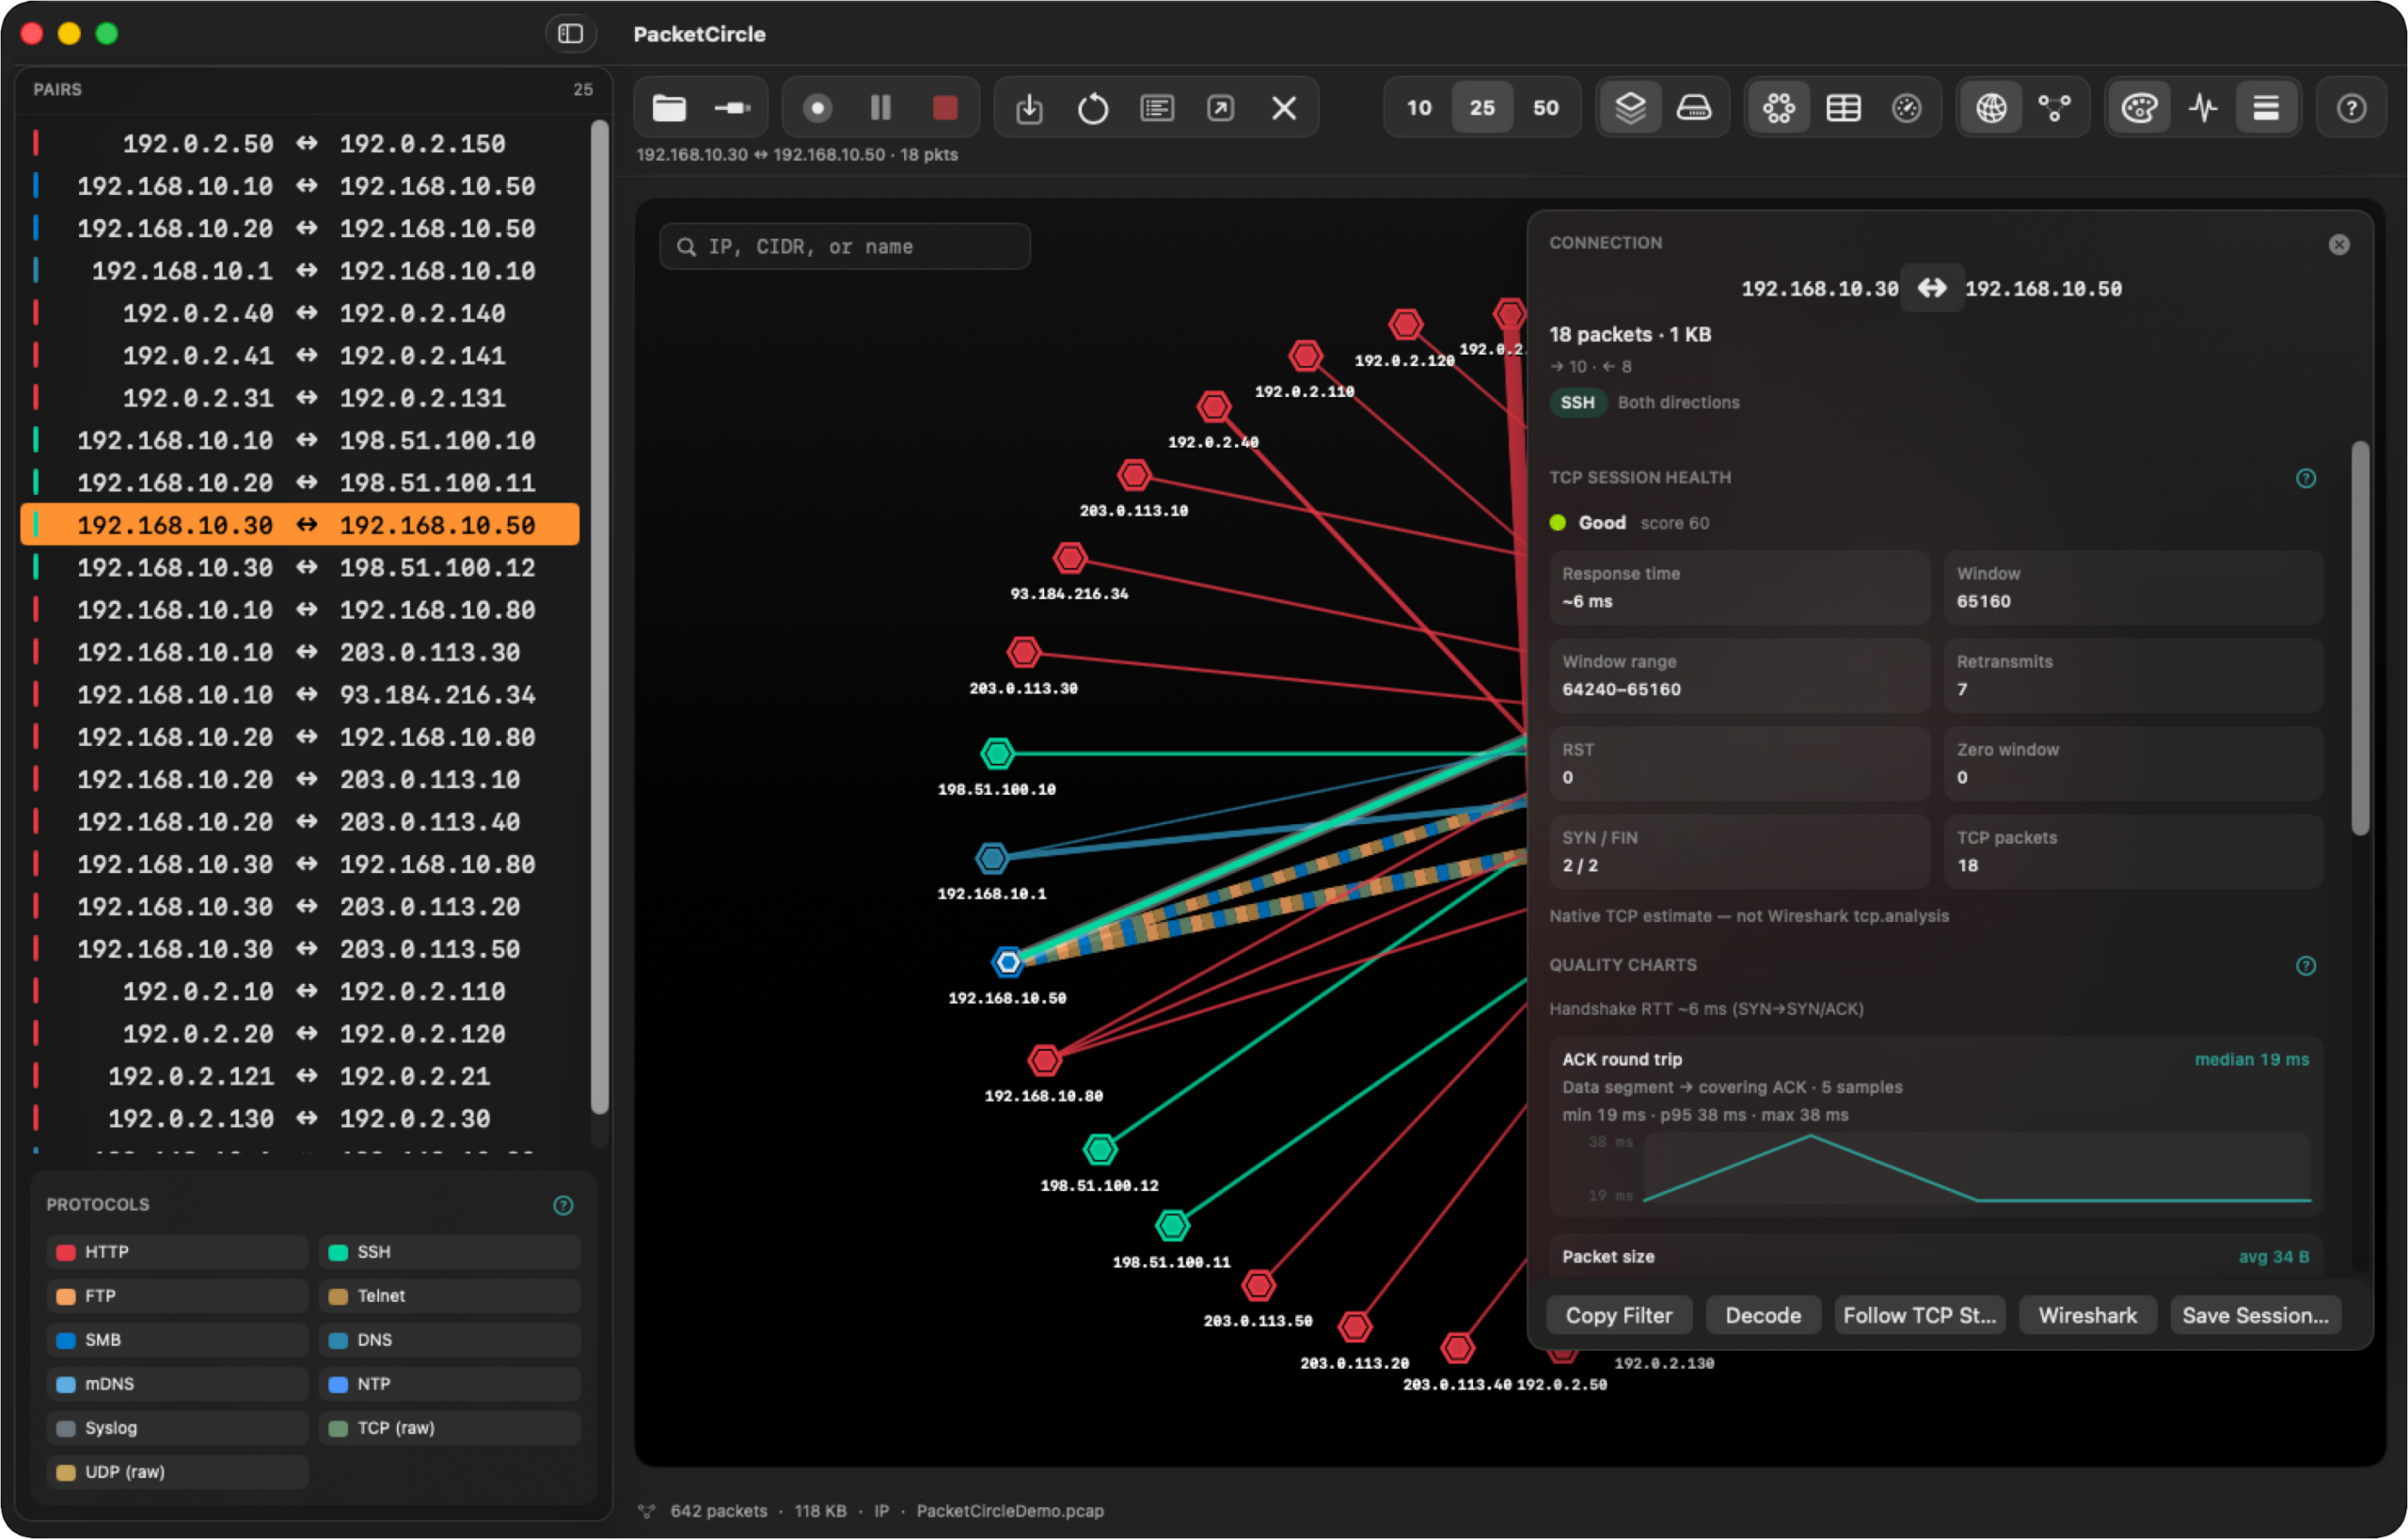
TCP session health, handshake RTT, and ACK round-trip quality charts, right next to the packet counts.
| Section | Contents |
|---|---|
| Header | Endpoints, packet/byte totals, directional split, protocol badge, direction (both/one-way) |
| TCP session health | Grade (Excellent/Good/Fair/Poor) and score, response time, window size & range, retransmits, RST count, zero-window count, SYN/FIN count, TCP packet count. Footer note: “Native TCP estimate — not Wireshark tcp.analysis.” |
| Quality charts | Handshake RTT (SYN → SYN/ACK), and an ACK-round-trip sparkline with median/min/p95/max labels |
| Packet size | Average packet size for the pair |
Actions: Copy Filter · Decode (filtered to this pair) · Follow TCP Stream · Wireshark · Save Session… (save just this conversation as its own file). Closing the popup also clears the selection, so the sidebar row and circle arc stop being highlighted.
6. Table view
A sortable table of the same Top-N pairs, with real analysis columns rather than just addresses.
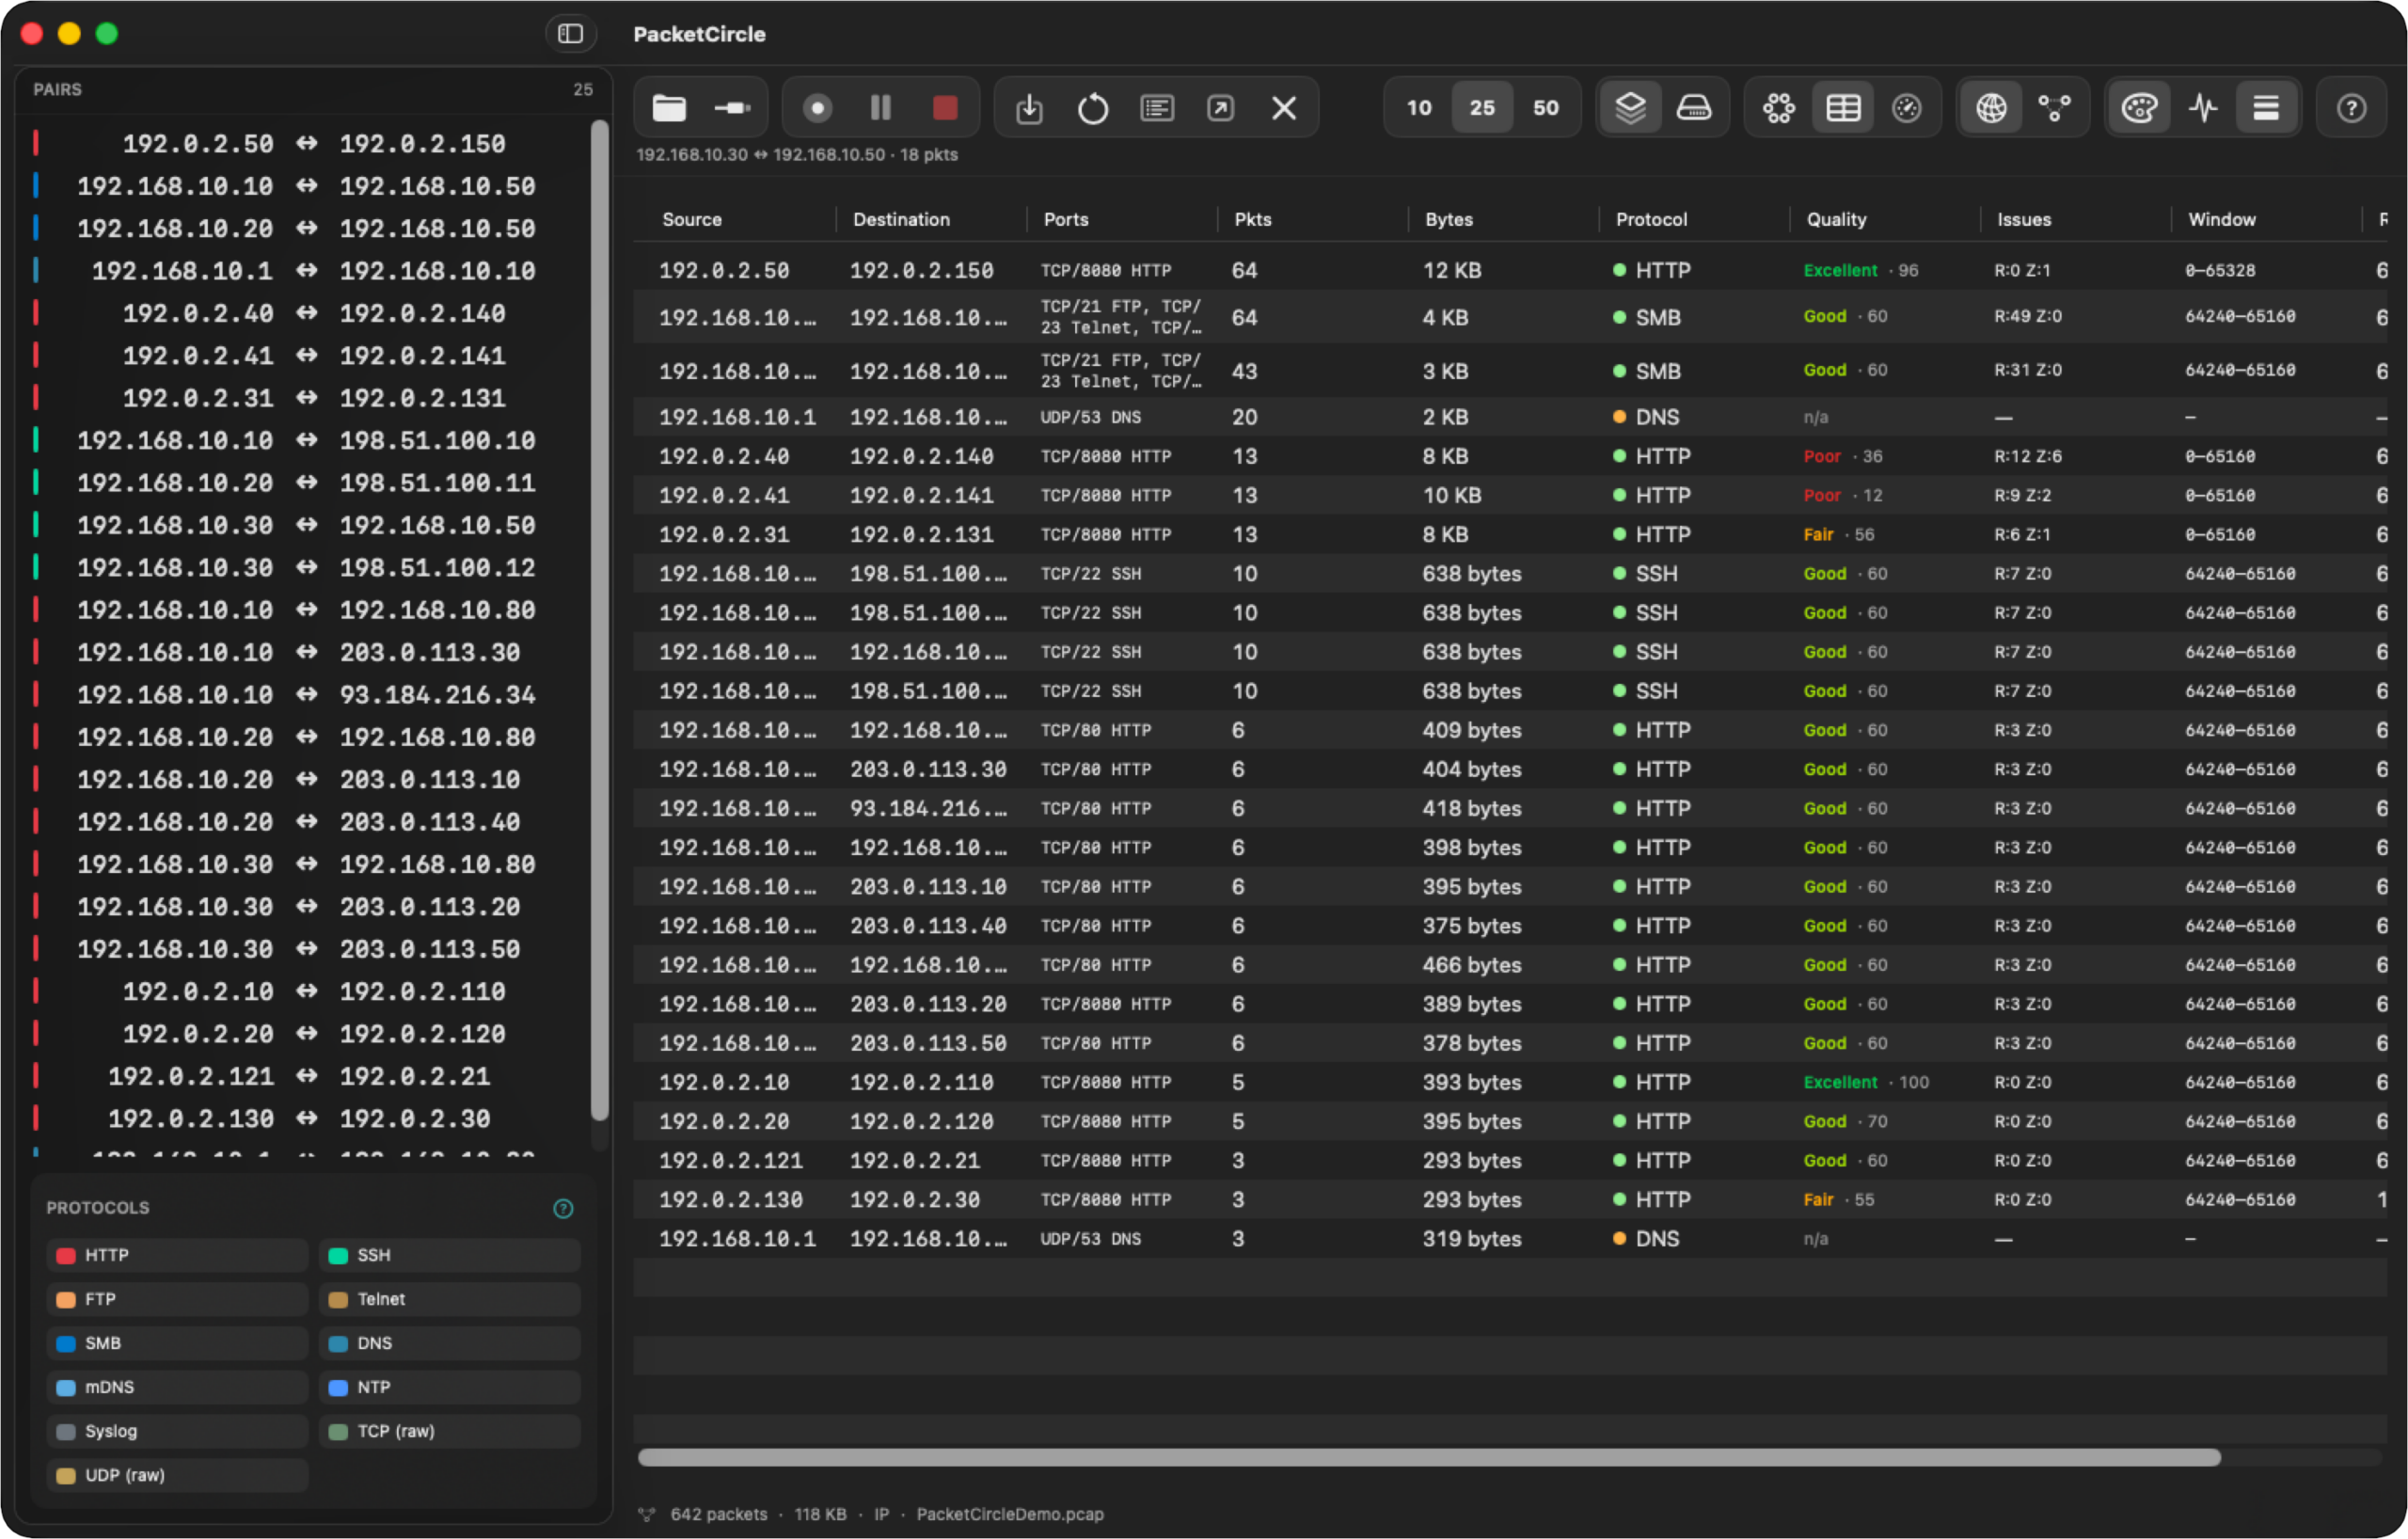
Source, Destination, Ports, Pkts, Bytes, Protocol, Quality (grade + score), Issues (R:n Z:n), Window, plus RTT/health columns.
7. Gauges view
A dashboard of rate gauges and distribution charts: arc gauges for packets/s, bytes/s, and errors/s (labeled “Session average” on a static capture, “Instantaneous” with a live sparkline during capture/replay), plus Top Talkers and Top Protocols bar charts.
Since 1.3.1 the Hosts, Protocols and TCP health panels are clickable and apply the matching Circle filter — see §17.3.
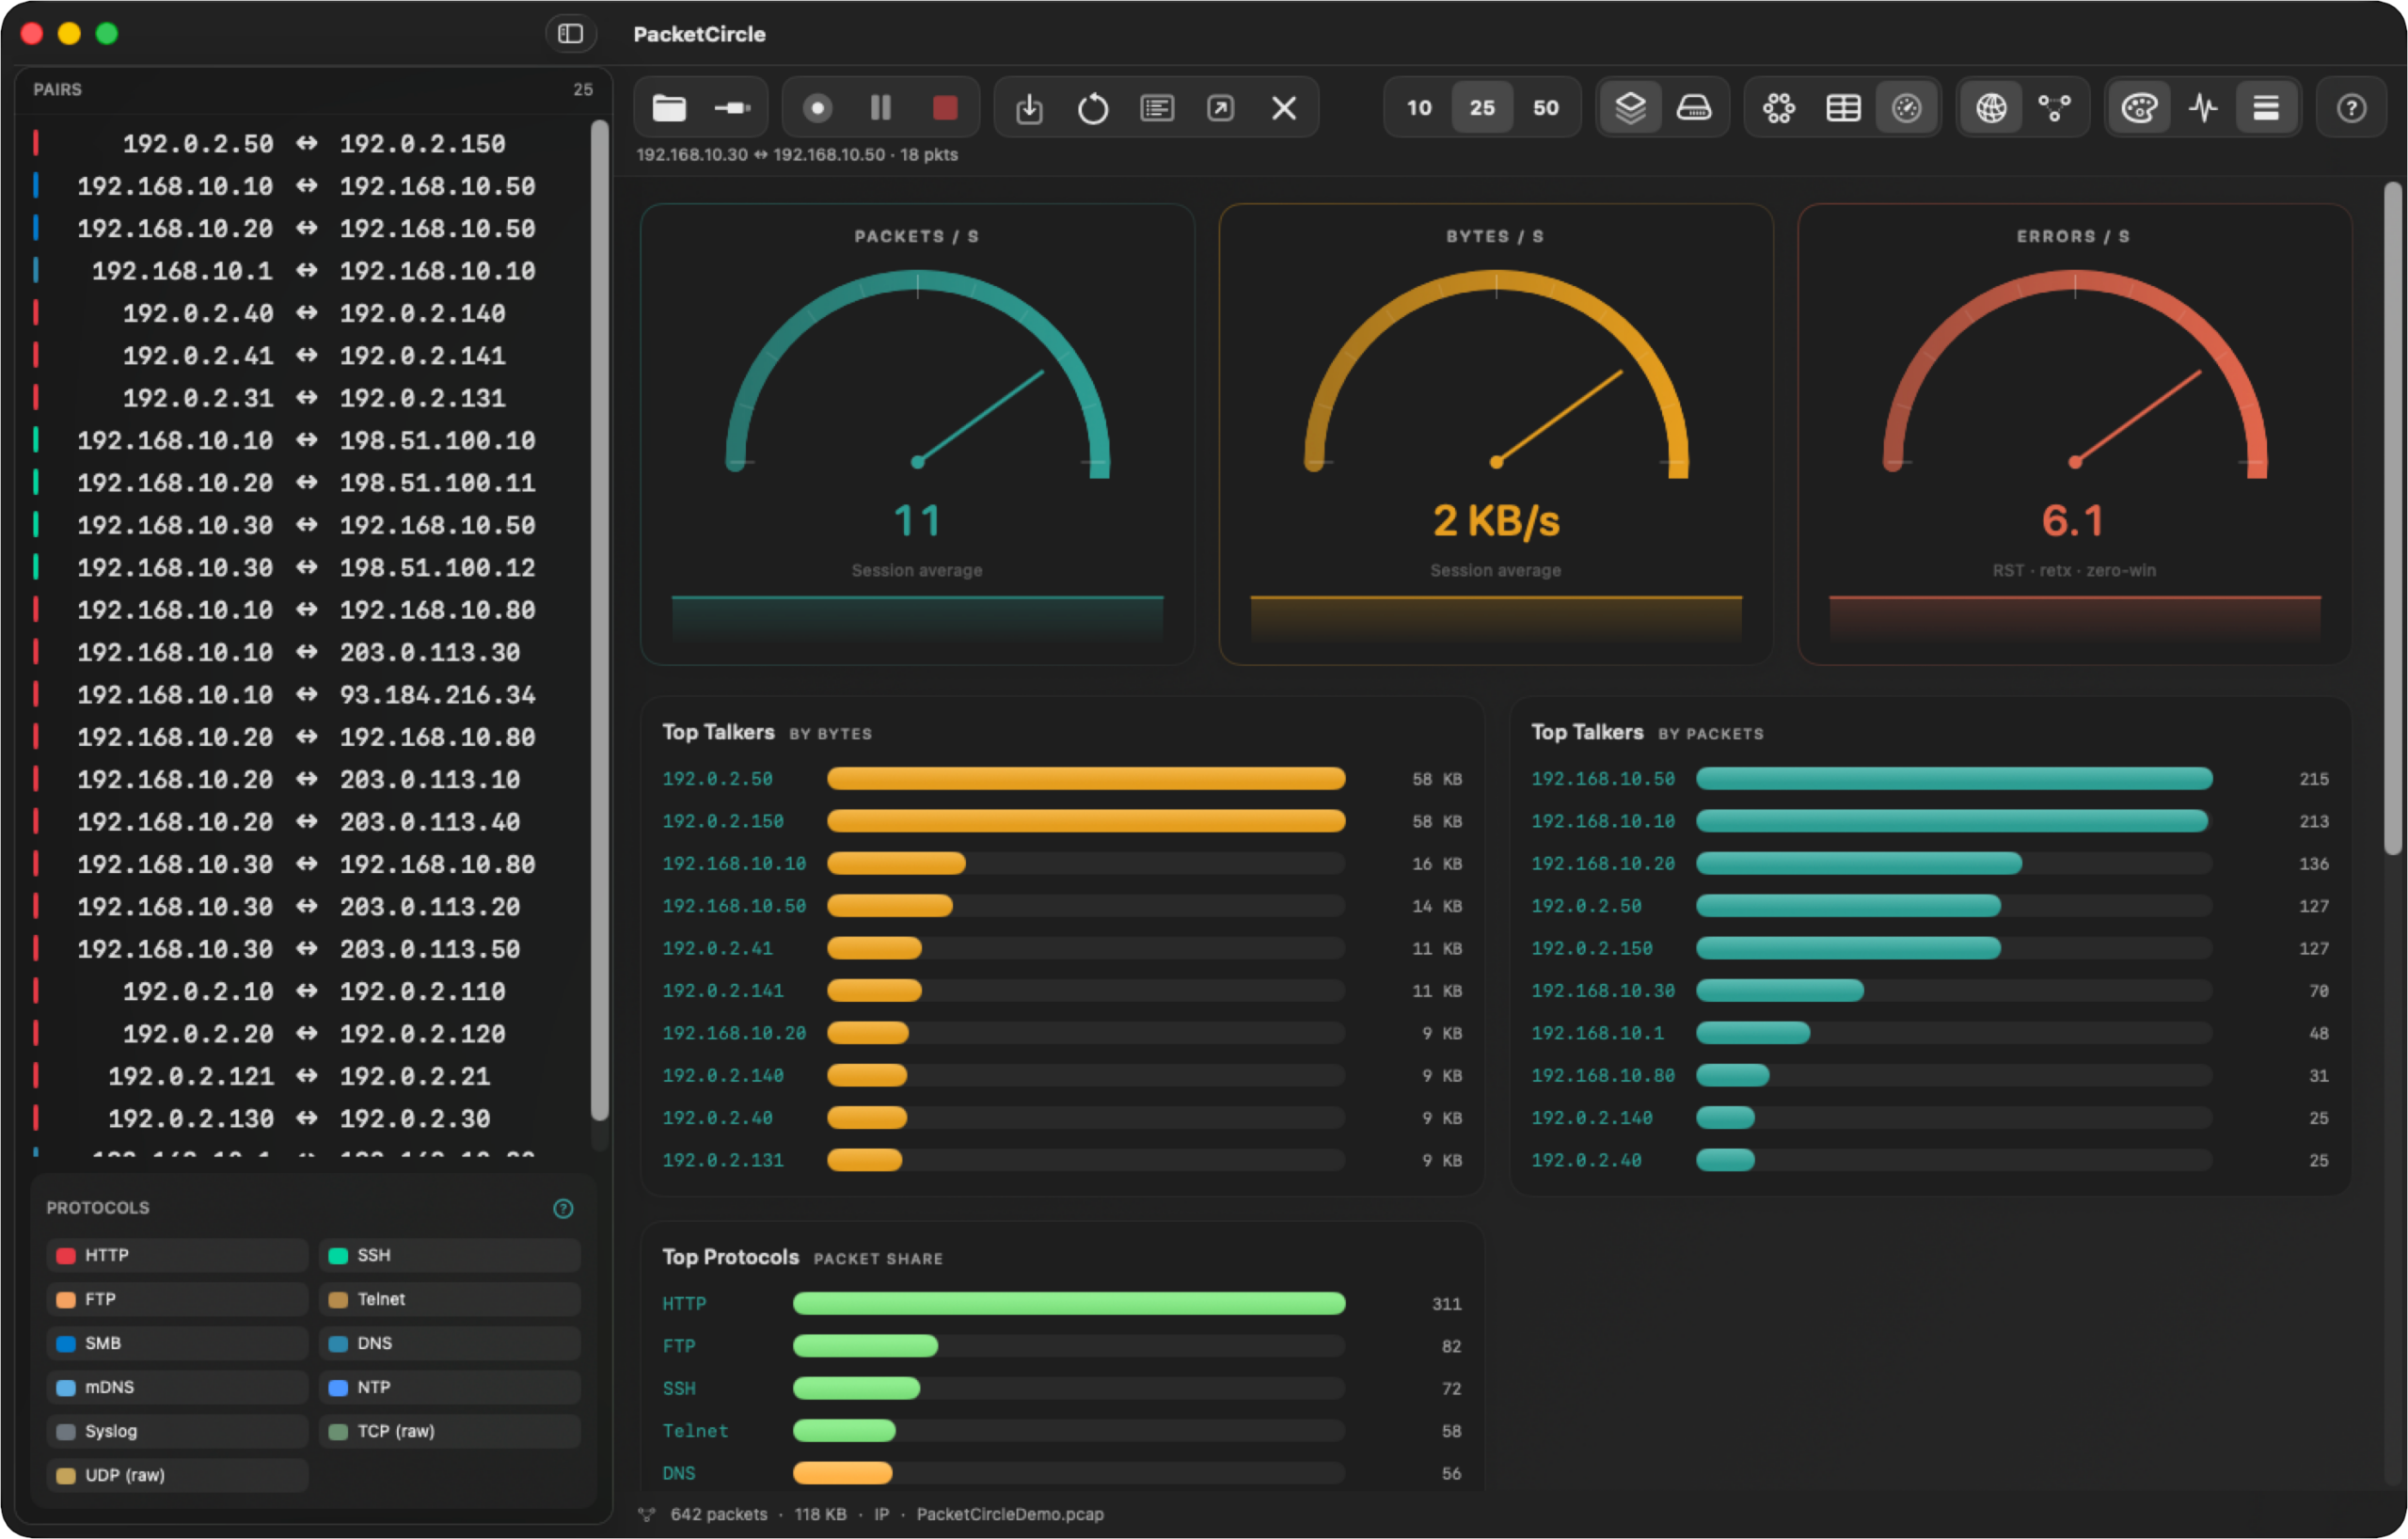
Rate gauges, Top Talkers, and Top Protocols.
8. Decode window
Decode opens in its own window (⇧⌘D, or the toolbar Decode button) so you can keep the Circle in view while reading packets.
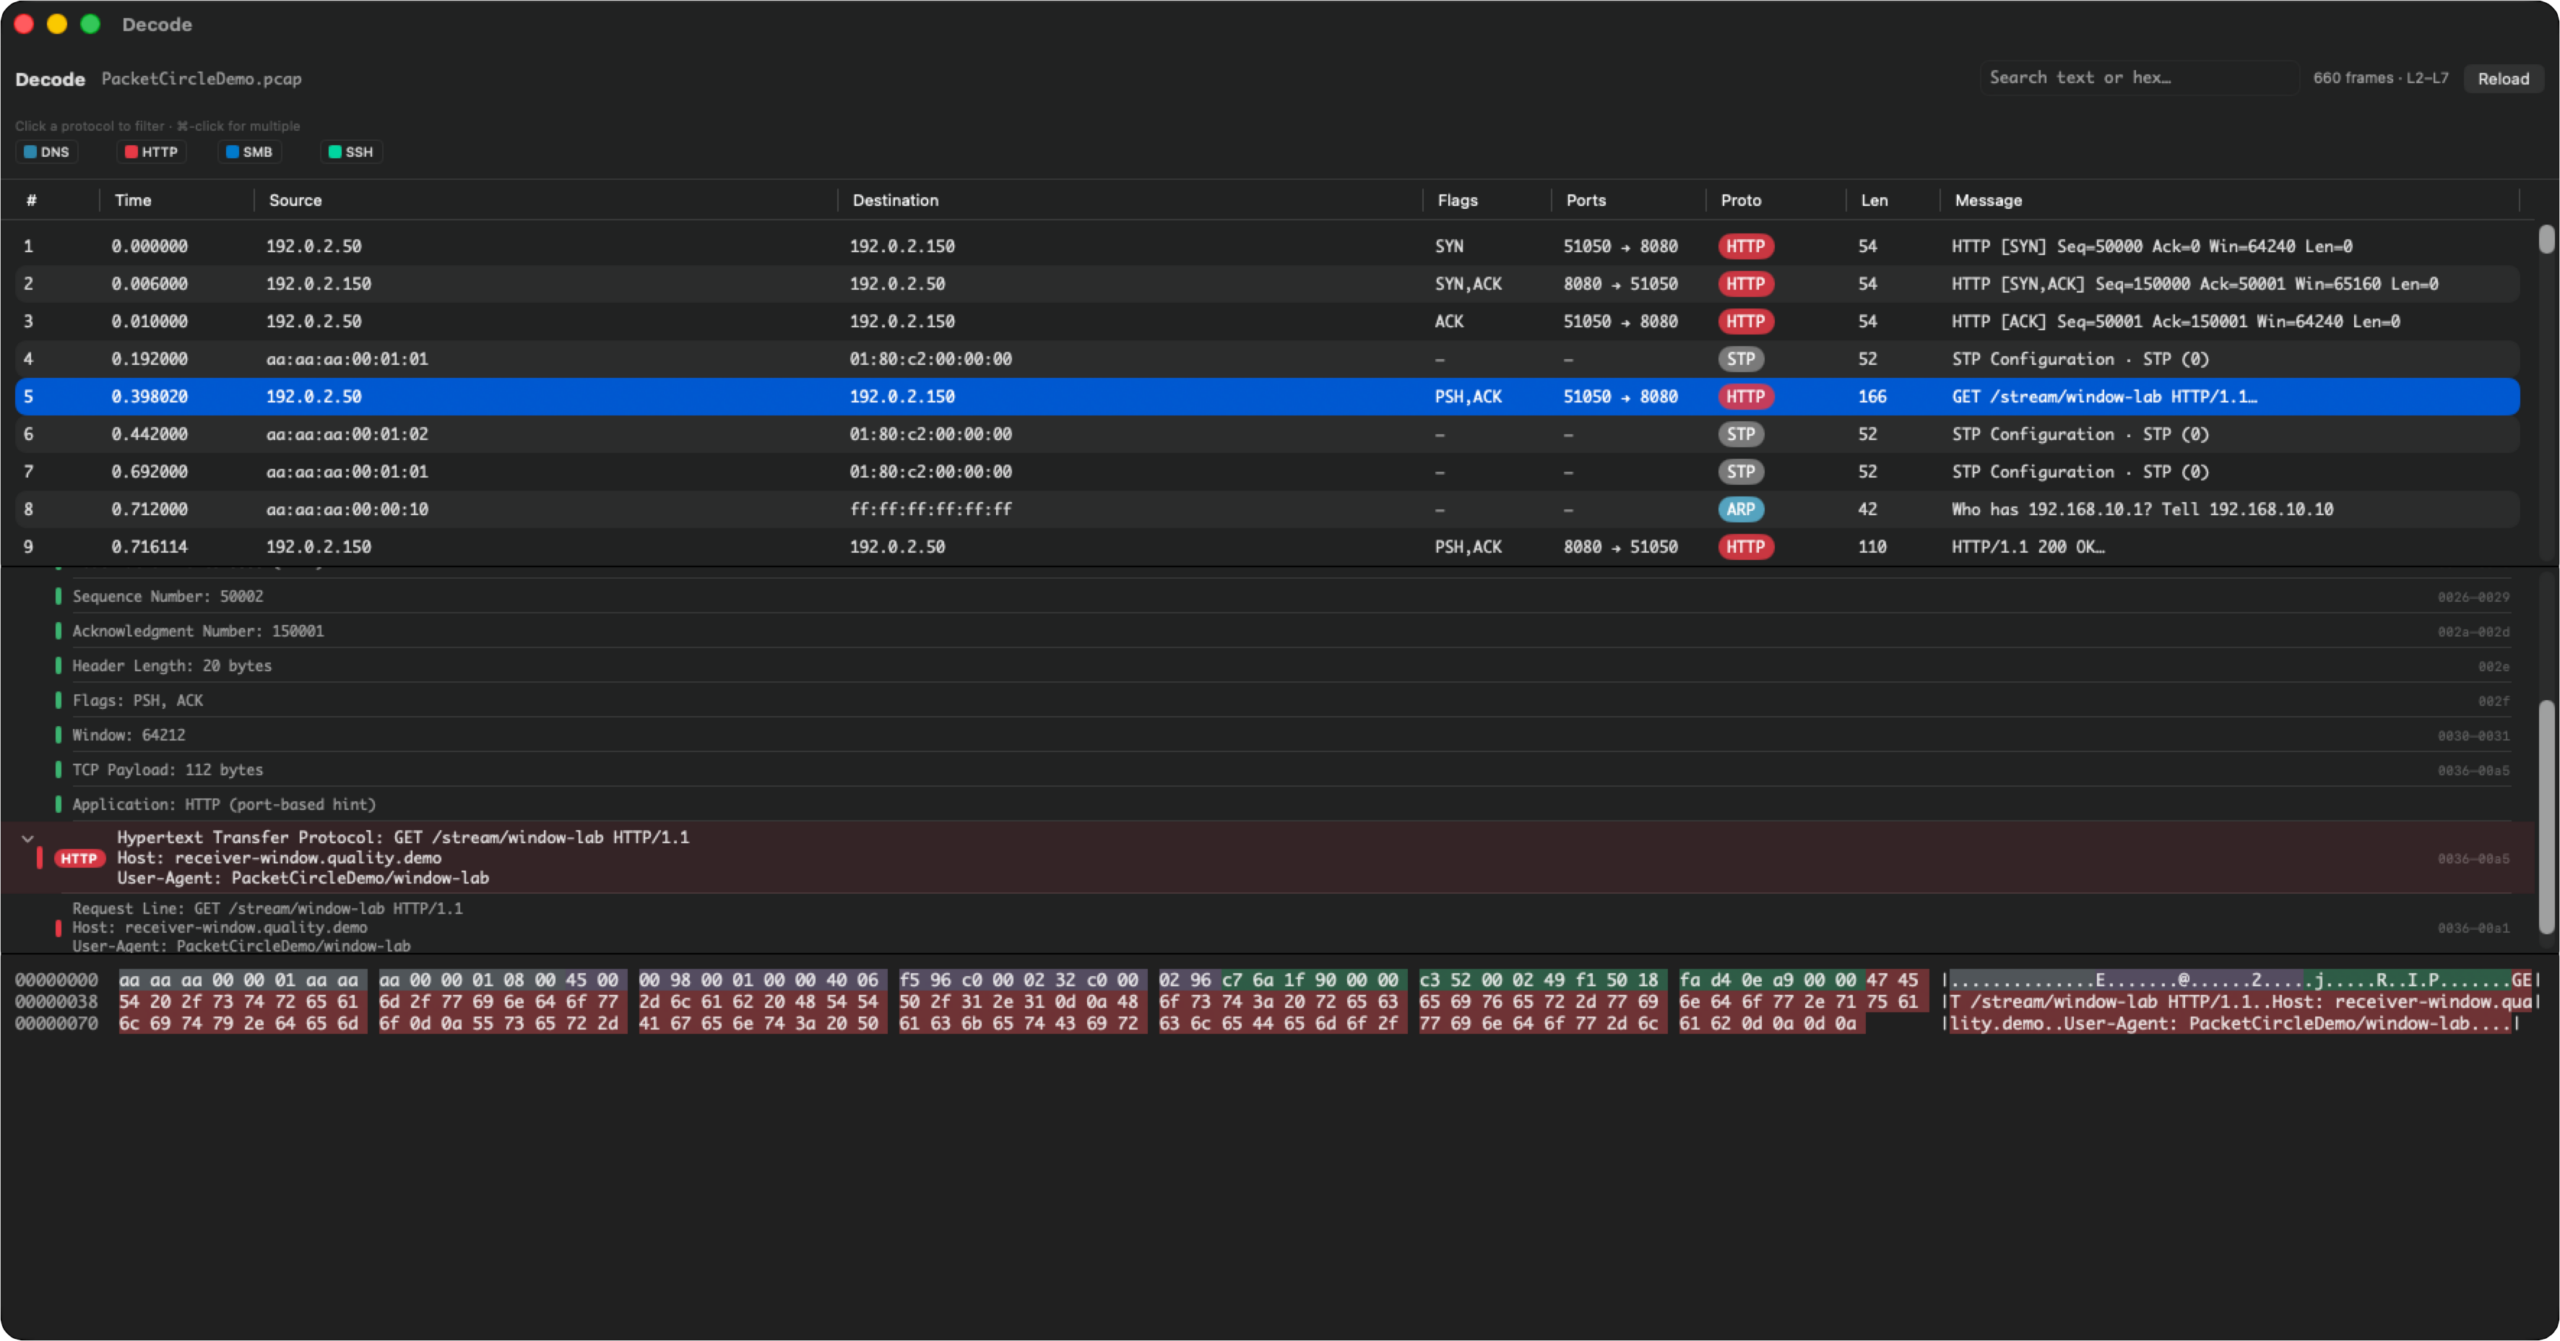
Filter chips, packet list, expandable protocol tree, and synced hex dump.
| Area | Contents |
|---|---|
| Header | Capture name, frame count and layer range (e.g. “660 frames · L2–L7”), text/hex search, Reload |
| Filter chips | One per protocol seen — click to filter, ⌘-click for multiple |
| Packet list | #, Time, Source, Destination, Flags, Ports, Proto, Len, Message |
| Protocol tree | Expandable frame detail down through the recognized application layer |
| Hex dump | Byte-for-byte view of the selected frame, synced to the tree selection |
Open it filtered to one conversation via Decode in the connection popup, or unfiltered via the toolbar/⇧⌘D for the whole capture.
9. Follow TCP Stream
An in-window modal (not a separate window) that reassembles one TCP flow’s payload bytes.
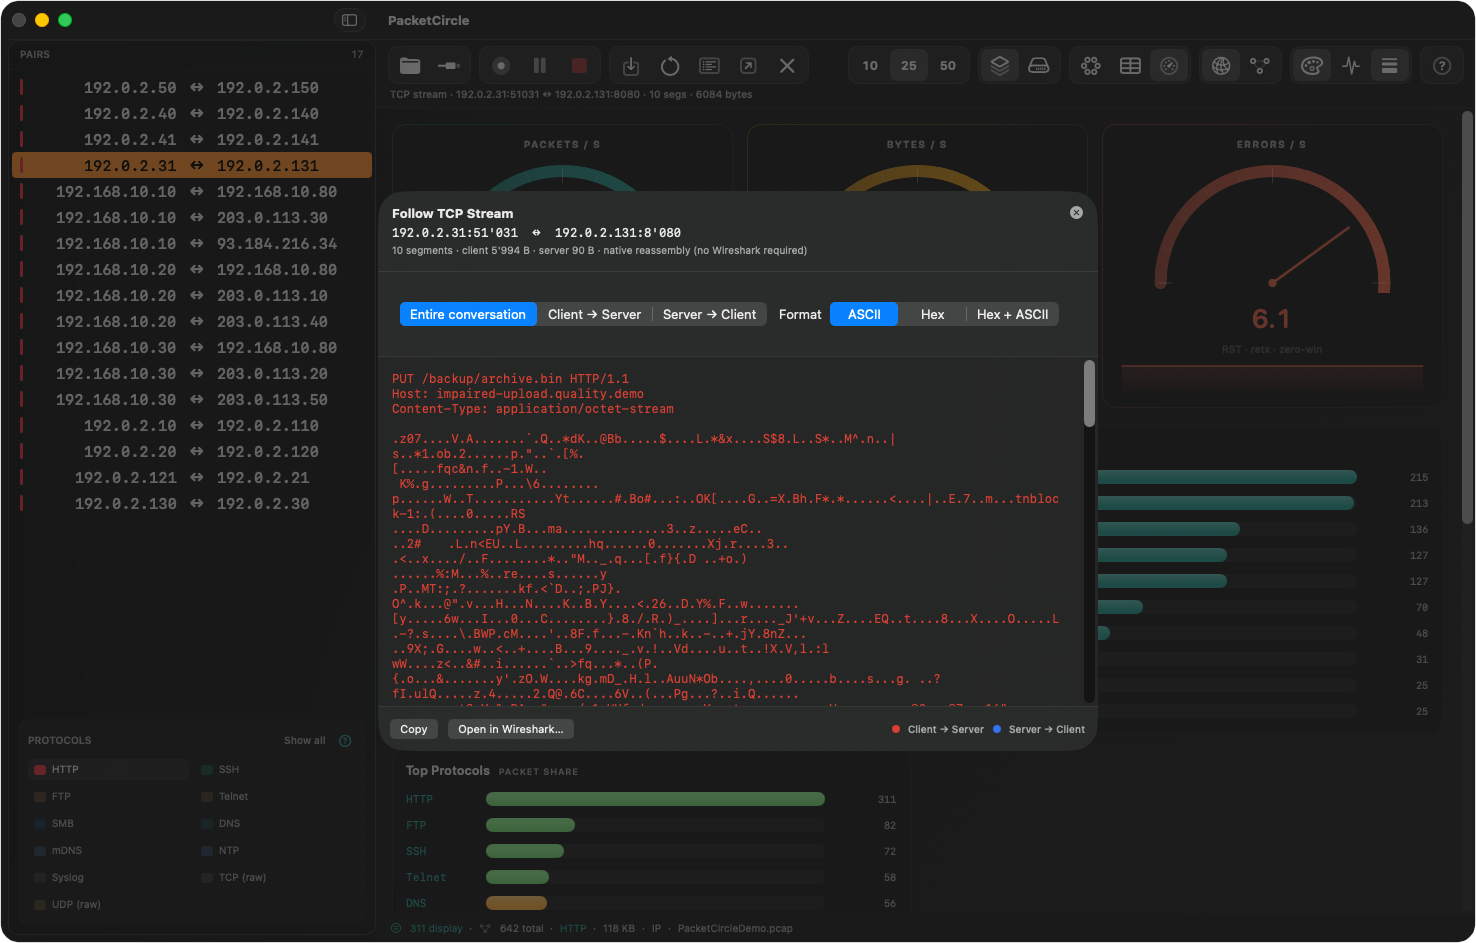
Client/server bytes color-coded, with direction and format controls.
| Control | Options |
|---|---|
| Direction | Entire conversation · Client → Server · Server → Client |
| Format | ASCII · Hex · Hex + ASCII |
| Actions | Copy · Open in Wireshark… |
10. Live capture
Interfaces… (⇧⌘I) opens a sheet listing local interfaces (native, live rates via dumpcap) with a traffic sparkline and packets/s per interface.
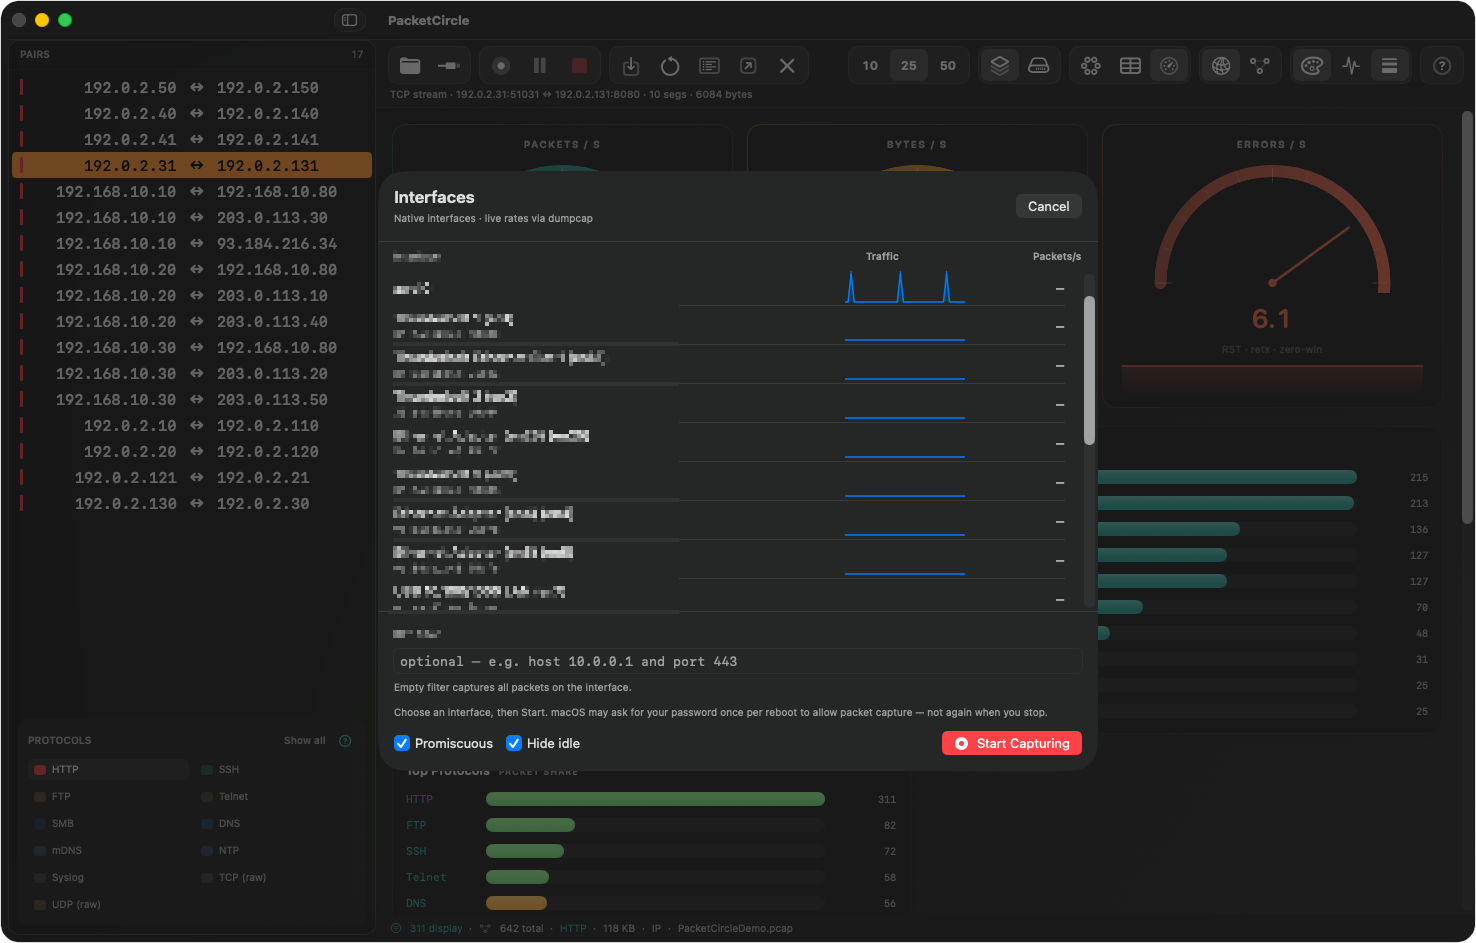
Interface list, optional BPF filter, Promiscuous / Hide idle toggles.
macOS may ask for your password once per reboot to allow packet capture — not again when you stop. Once running, the status line reads e.g. ● CAPTURING · en0 · 292 pkts · 34 pairs, and Gauges switch to Instantaneous readings with live sparklines.
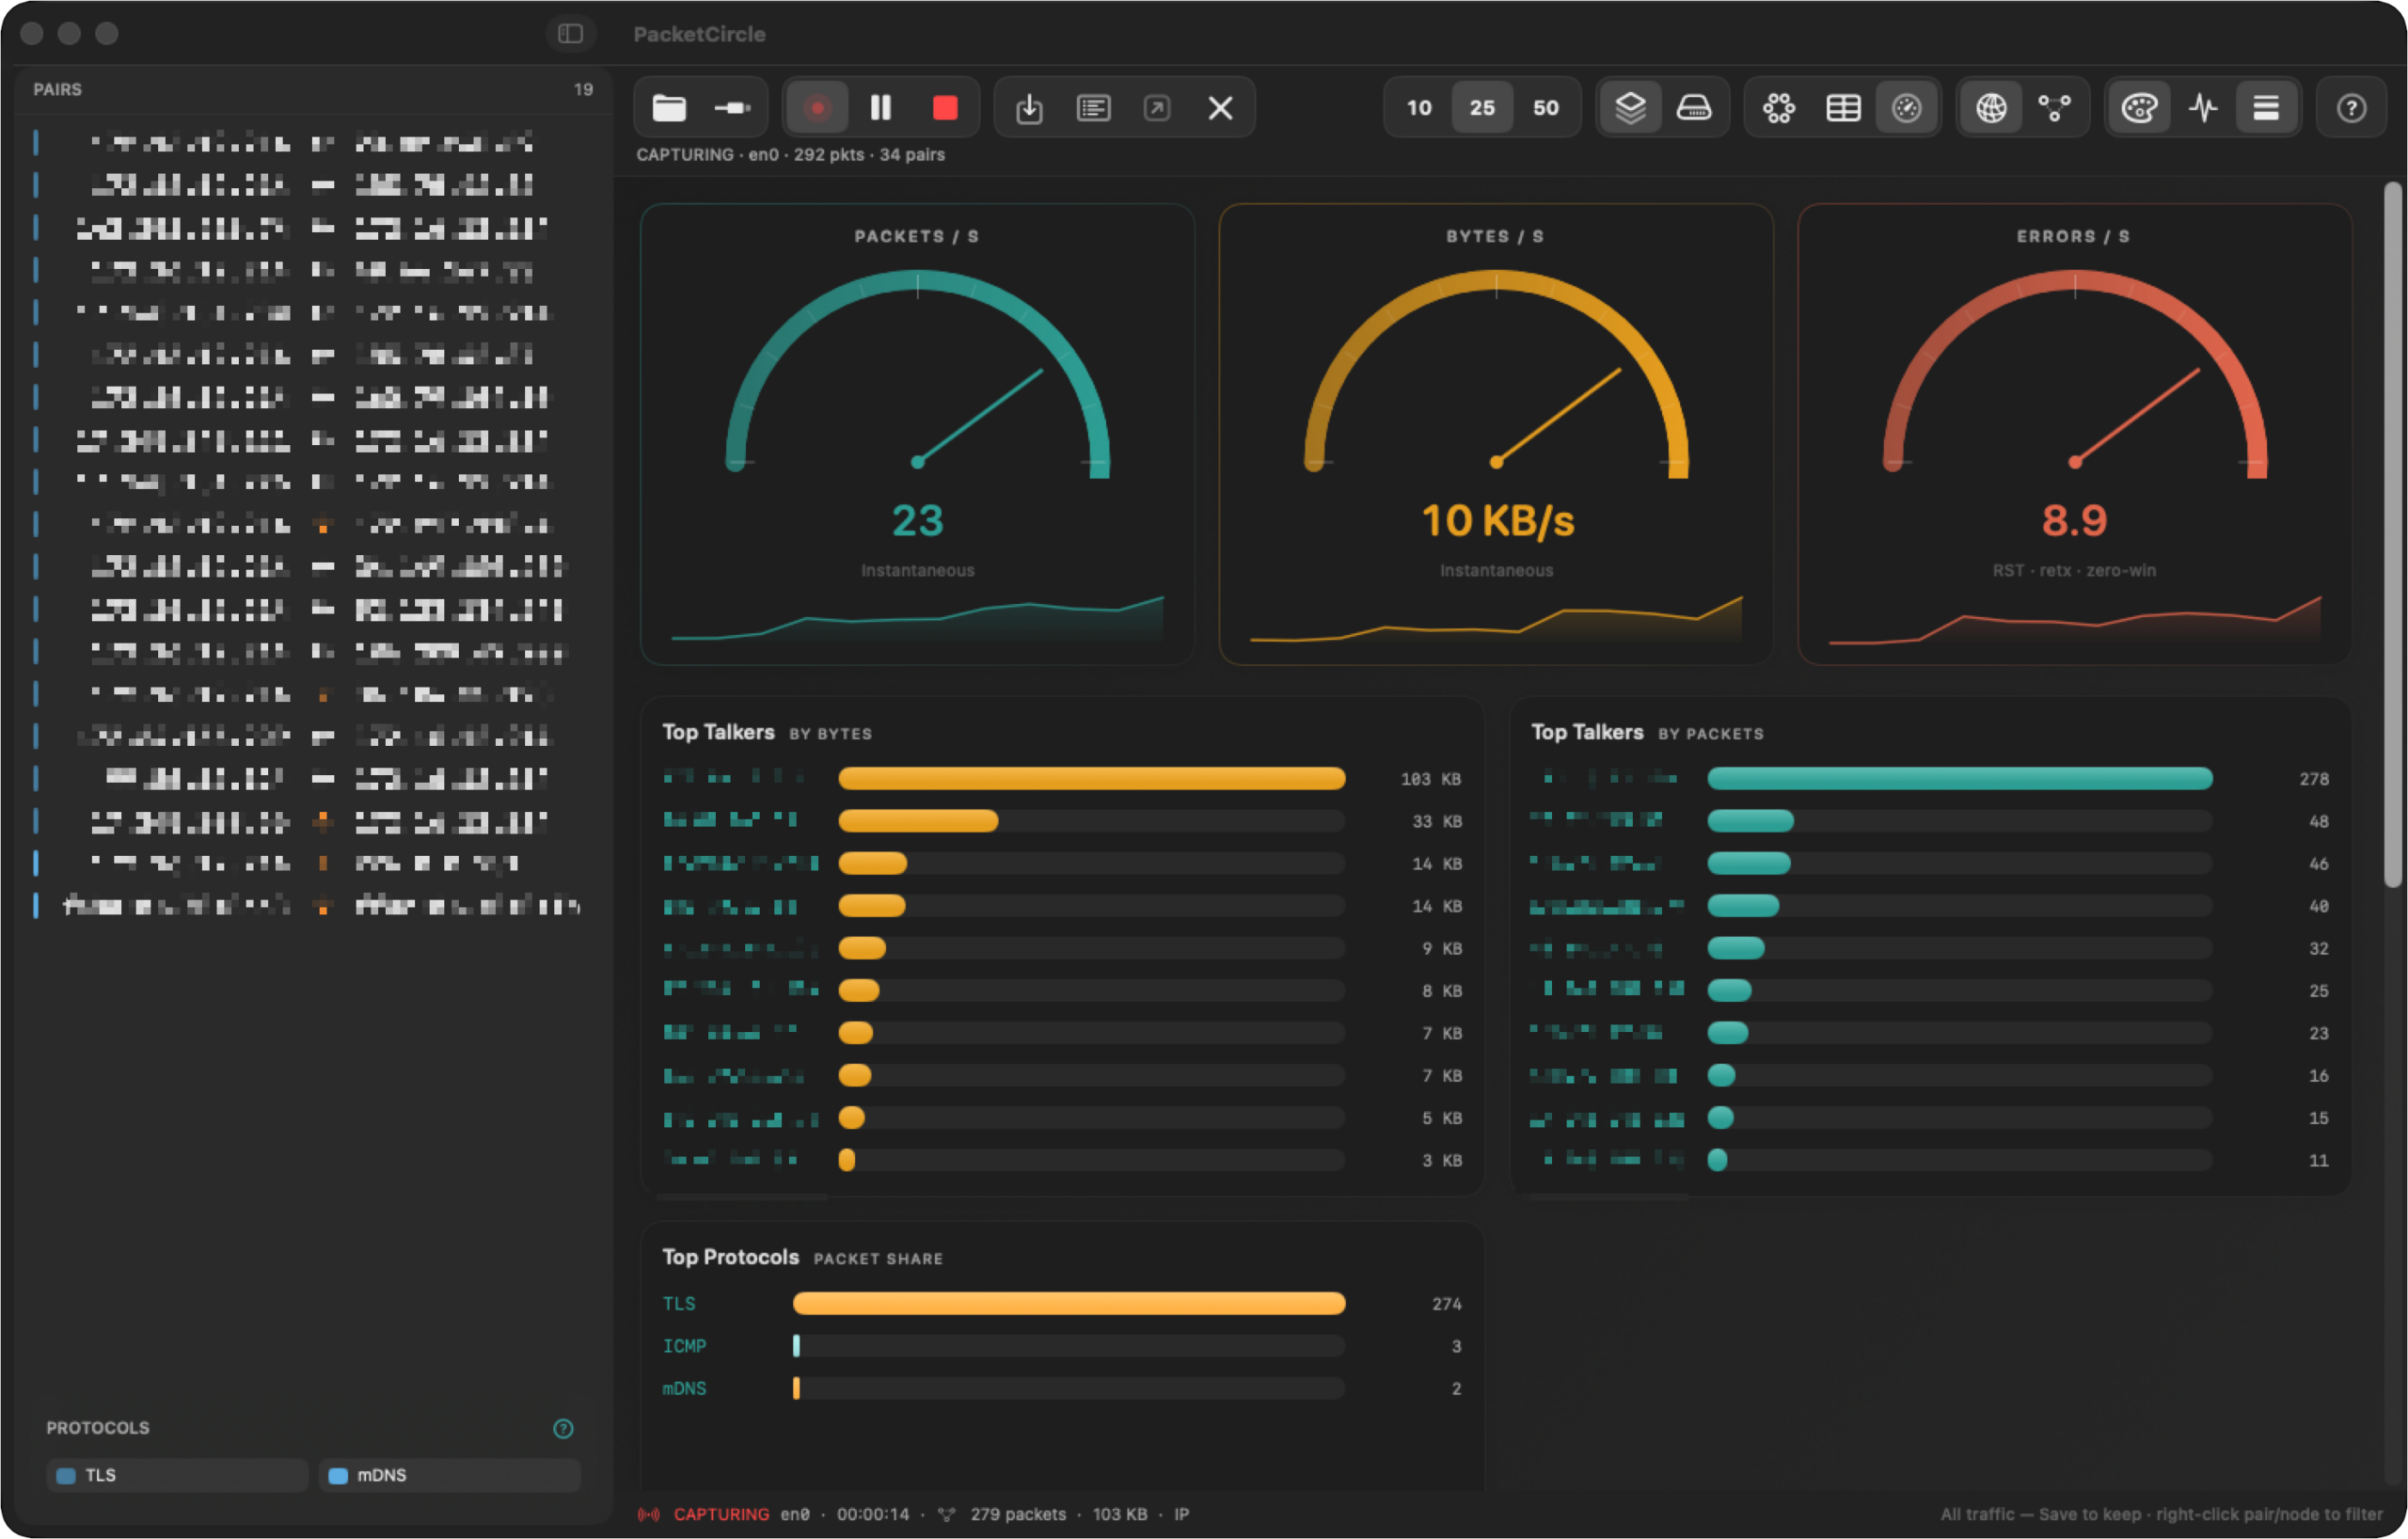
Live capture — footer reminds: “All traffic — Save to keep · right-click pair/node to filter.”
Right-click actions on the circle (Restart capture · this conversation / · host) restart the live capture with a BPF filter scoped to just that traffic.
11. Replay and Demo Mode
Demo Mode loads a bundled sample capture — the fastest way to see the app populated without your own PCAP; every screenshot in this manual uses it. Replay (⌥⌘R) replays an already-open file at its original inter-frame timing, so arcs and gauges animate the way they would live. Stop (⌘.) ends it and returns to the static full-file view.
12. Settings
Settings (⌘,) has these panes: General, Quality, Expert, Sanitize, Report, Decode and Colors. The sections below describe the display, decode and color settings; the Expert, Sanitize and Report panes are covered in §16.
12.1 Display
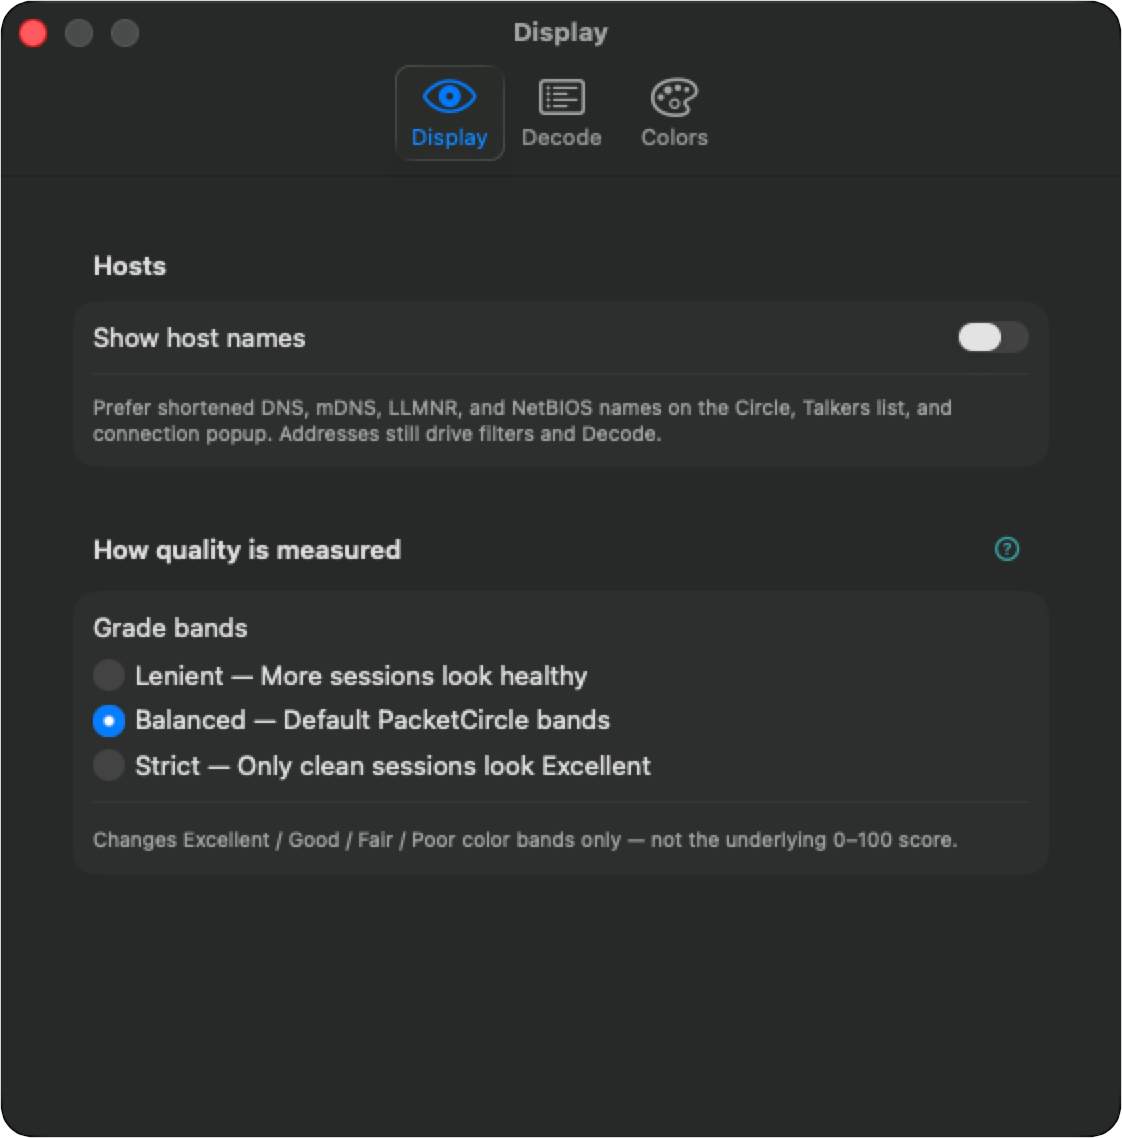
Host names toggle and quality grade-band selector.
| Setting | Purpose |
|---|---|
| Show host names | Prefer shortened DNS / mDNS / LLMNR / NetBIOS names on the Circle, Talkers list, and connection popup. Addresses still drive filters and Decode regardless. Since 1.3.1 the on/off switch is the Names button beside IP / MAC in the view-options bar; Settings no longer has it. |
| Grade bands | Lenient (more sessions look healthy) · Balanced (default) · Strict (only clean sessions look Excellent). Changes only the color bands, not the underlying 0–100 score. |
12.2 Decode
Monospace font picker with live preview, and a 9–20pt size slider — applies to the Decode packet list, protocol tree, and hex dump.
12.3 Colors
Per-protocol color overrides for the Decode window, with a Reset All to restore defaults.
13. Wireshark integration
Open in Wireshark… — from the toolbar, the connection popup, or Follow TCP Stream — hands the current capture (or filtered view) off to a locally installed Wireshark, with the equivalent display filter already copied to the clipboard. Disabled if Wireshark isn’t installed.
14. Keyboard shortcuts
| Shortcut | Action |
|---|---|
| ⌘O | Open Capture… |
| ⌘S | Save Capture As… |
| ⌥⌘S | Save Capture to Downloads |
| ⇧⌘I | Interfaces… |
| ⌥⌘D | Demo Mode |
| ⌥⌘R | Replay · Original Speed |
| ⇧⌘D | Decode |
| ⇧⌘P | Pause / Resume (live capture only) |
| ⌘. | Stop (live capture or replay) |
| ⇧⌘W | Close Capture |
| ⌘, | Settings |
| ⌘Q | Quit |
15. Workflows
A. First look at a capture
⌘O to open a file (or Demo Mode). On Circle, skim arcs; switch edge color to Quality to spot Fair/Poor sessions. Click an arc for the connection popup, or open Table for a sortable list with quality/issue columns.
B. Diagnose a bad TCP session
Edge color → Quality; look for orange/red arcs, or sort Table by Quality. Click the arc → connection popup → read TCP session health and the quality charts. Follow TCP Stream for payload, or Decode for frame-by-frame detail. Save Session… to keep just this conversation. Reset clears the selection once you’re done.
C. Live triage on the wire
⇧⌘I → pick an interface, optionally set a BPF filter → Start Capturing. Watch Circle/Gauges update live; right-click a conversation → Restart capture · this conversation to narrow the live capture to just that traffic. ⇧⌘P to pause and inspect, ⌘. to stop and analyze the full trace.
D. Handoff to Wireshark
Select a conversation (or none, for the whole capture). Open in Wireshark… from the toolbar, the popup, or Follow TCP Stream — the display filter is copied automatically.
16. What’s new in 1.2.x (Tech Preview)
The macOS app shares PacketCircleCore with iOS, plus desktop chrome: multi-window Decode/Compare, live capture, Map, Pro tools, and Expert Alerts. Positioning is unchanged: not Wireshark, native analysis (not open source yet), no telemetry.
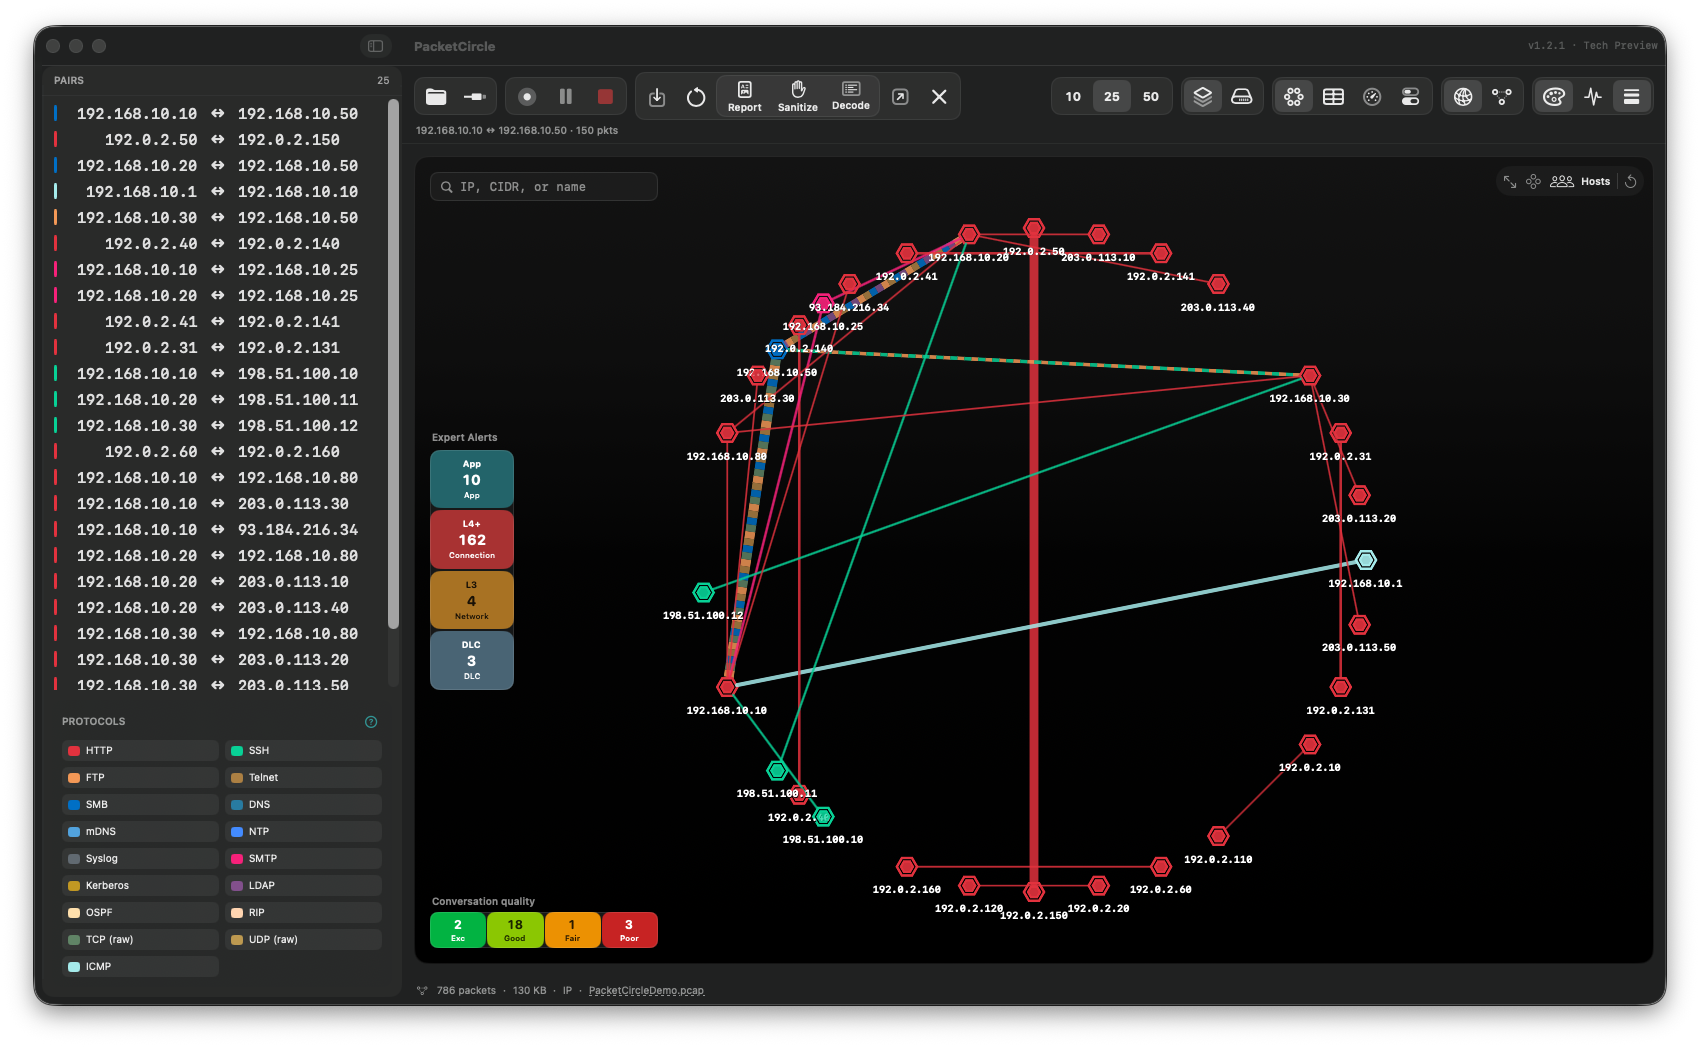
Circle view with the Expert Alerts strip (App / L4+ / L3 / DLC) and quality bar.
16.1 Getting started (Mac)
| Step | Action |
|---|---|
| 1 | Open a capture (File → Open…) or the demo from Help / empty state. |
| 2 | Use Circle (hosts / services), Gauges, Map, and the Pairs sidebar. |
| 3 | Click an edge for Connection details; use Decode, Follow TCP Stream, Compare…, or Wireshark as needed. |
| 4 | Tools / toolbar: Decode, Sanitize Capture…, Generate Report…. |
| 5 | PacketCircle → Settings… for quality, Expert, Sanitize, Report, Decode, Colors. |
Live capture (where entitled) and save options remain available from the Capture / File menus.
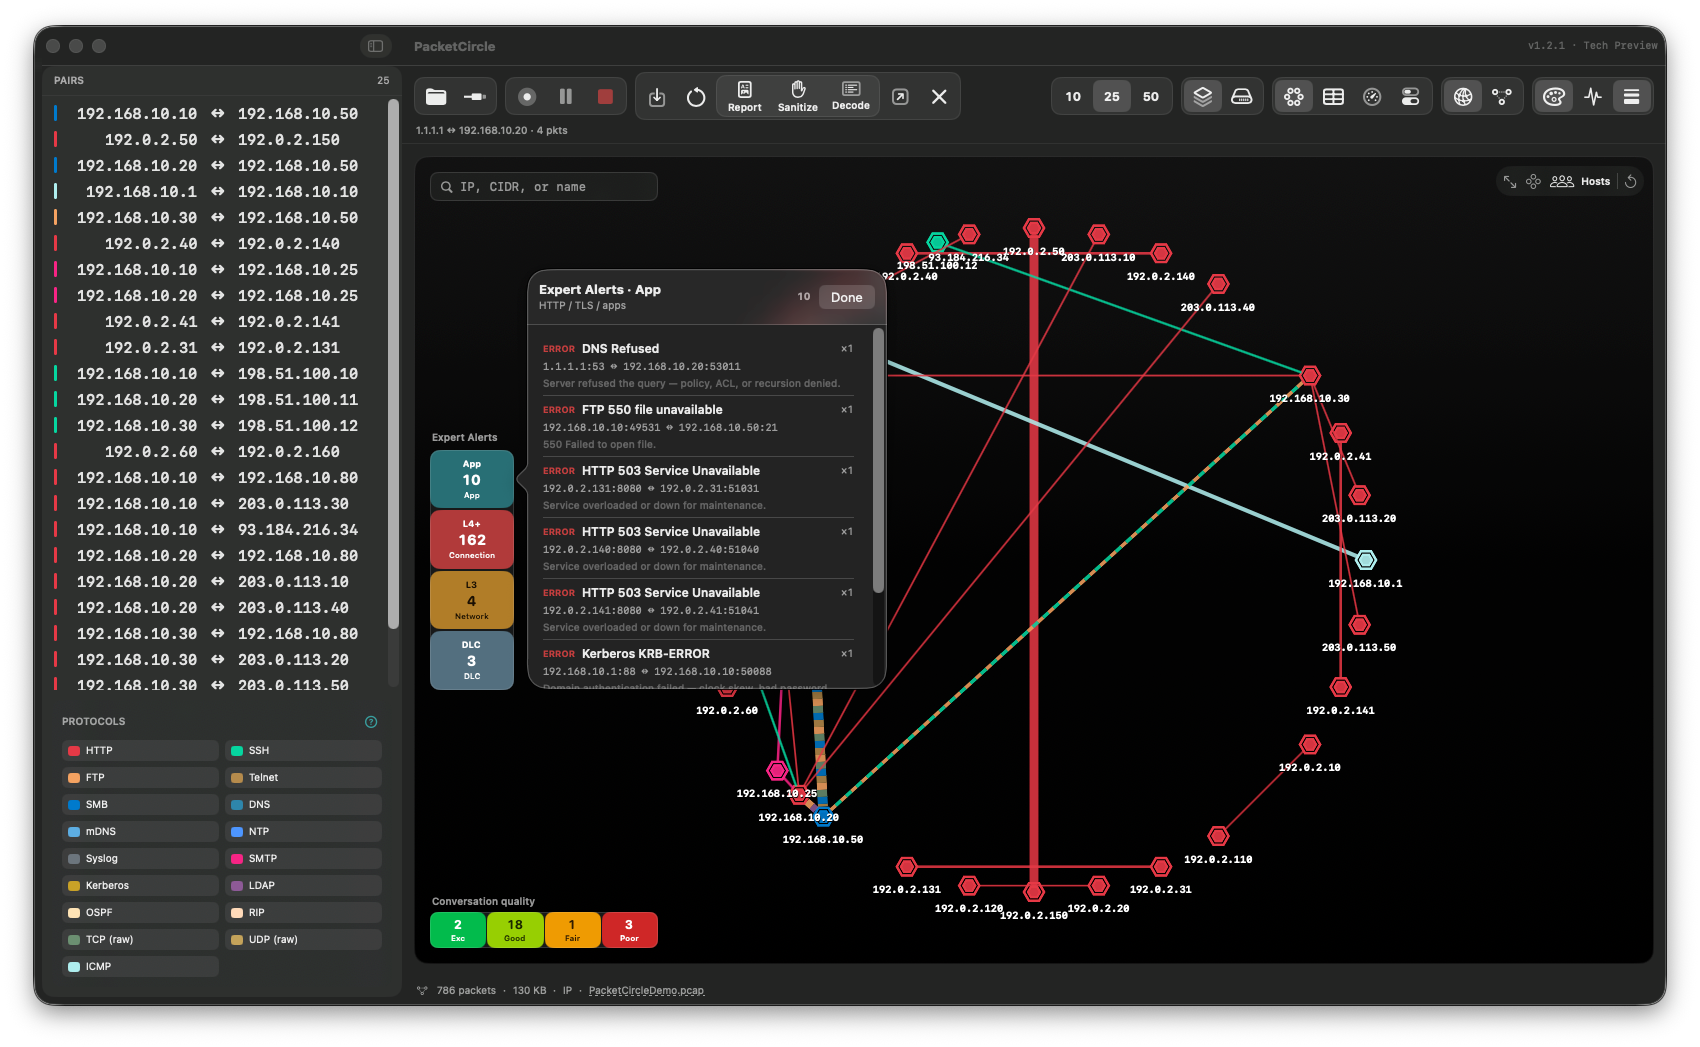
Expert Alerts browser popover — severity, summary, endpoints, and Suppress in the context menu.
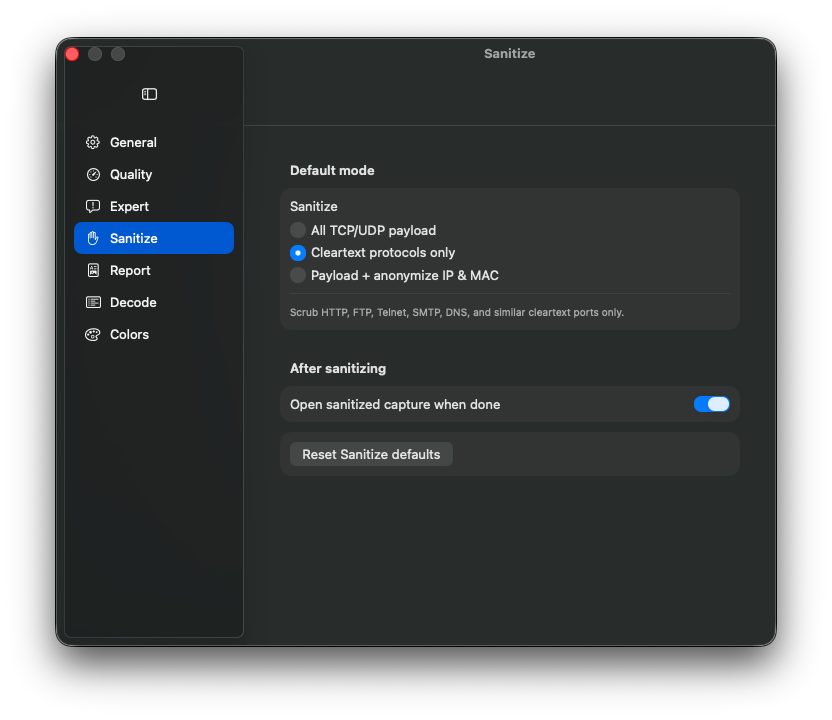
Tools / toolbar cluster with the Pro actions: Sanitize, Report, Decode.
16.2 Expert Alerts (Circle)
Left of the Circle: stacked chips App → L4+ → L3 → DLC. Counts are warnings and errors only.
| Band | Typical findings |
|---|---|
| App | HTTP 4xx/5xx, TLS alerts, SMTP/POP3/IMAP, FTP, DNS RCODEs, LDAP, Kerberos, SSH |
| L4+ | TCP quality / transport experts |
| L3 | ICMP unreachable / filtered / time-exceeded, IP TTL / fragment issues |
| DLC | True frame problems (demo includes intentional runts + giant). Normal short unpadded Ethernet frames are not counted as runts |
Use: Left-click a chip to filter conversations that have alerts in that band. Right-click a chip → Show … alerts… to browse hits; hover highlights the chord; click selects the pair (and the socket that raised the alert when ports are known). In the list, right-click a row → Suppress “…” to hide that message type from chips/lists. Re-enable under Settings → Expert.
The chip menu itself does not offer Suppress (browse only).
16.3 Connection panel Expert
Below the conversation summary (when findings exist), an Expert section lists merged messages for this pair: capture App/L3/DLC alerts, TCP quality experts, and (when relevant) STP / topology alerts from the Map pass.
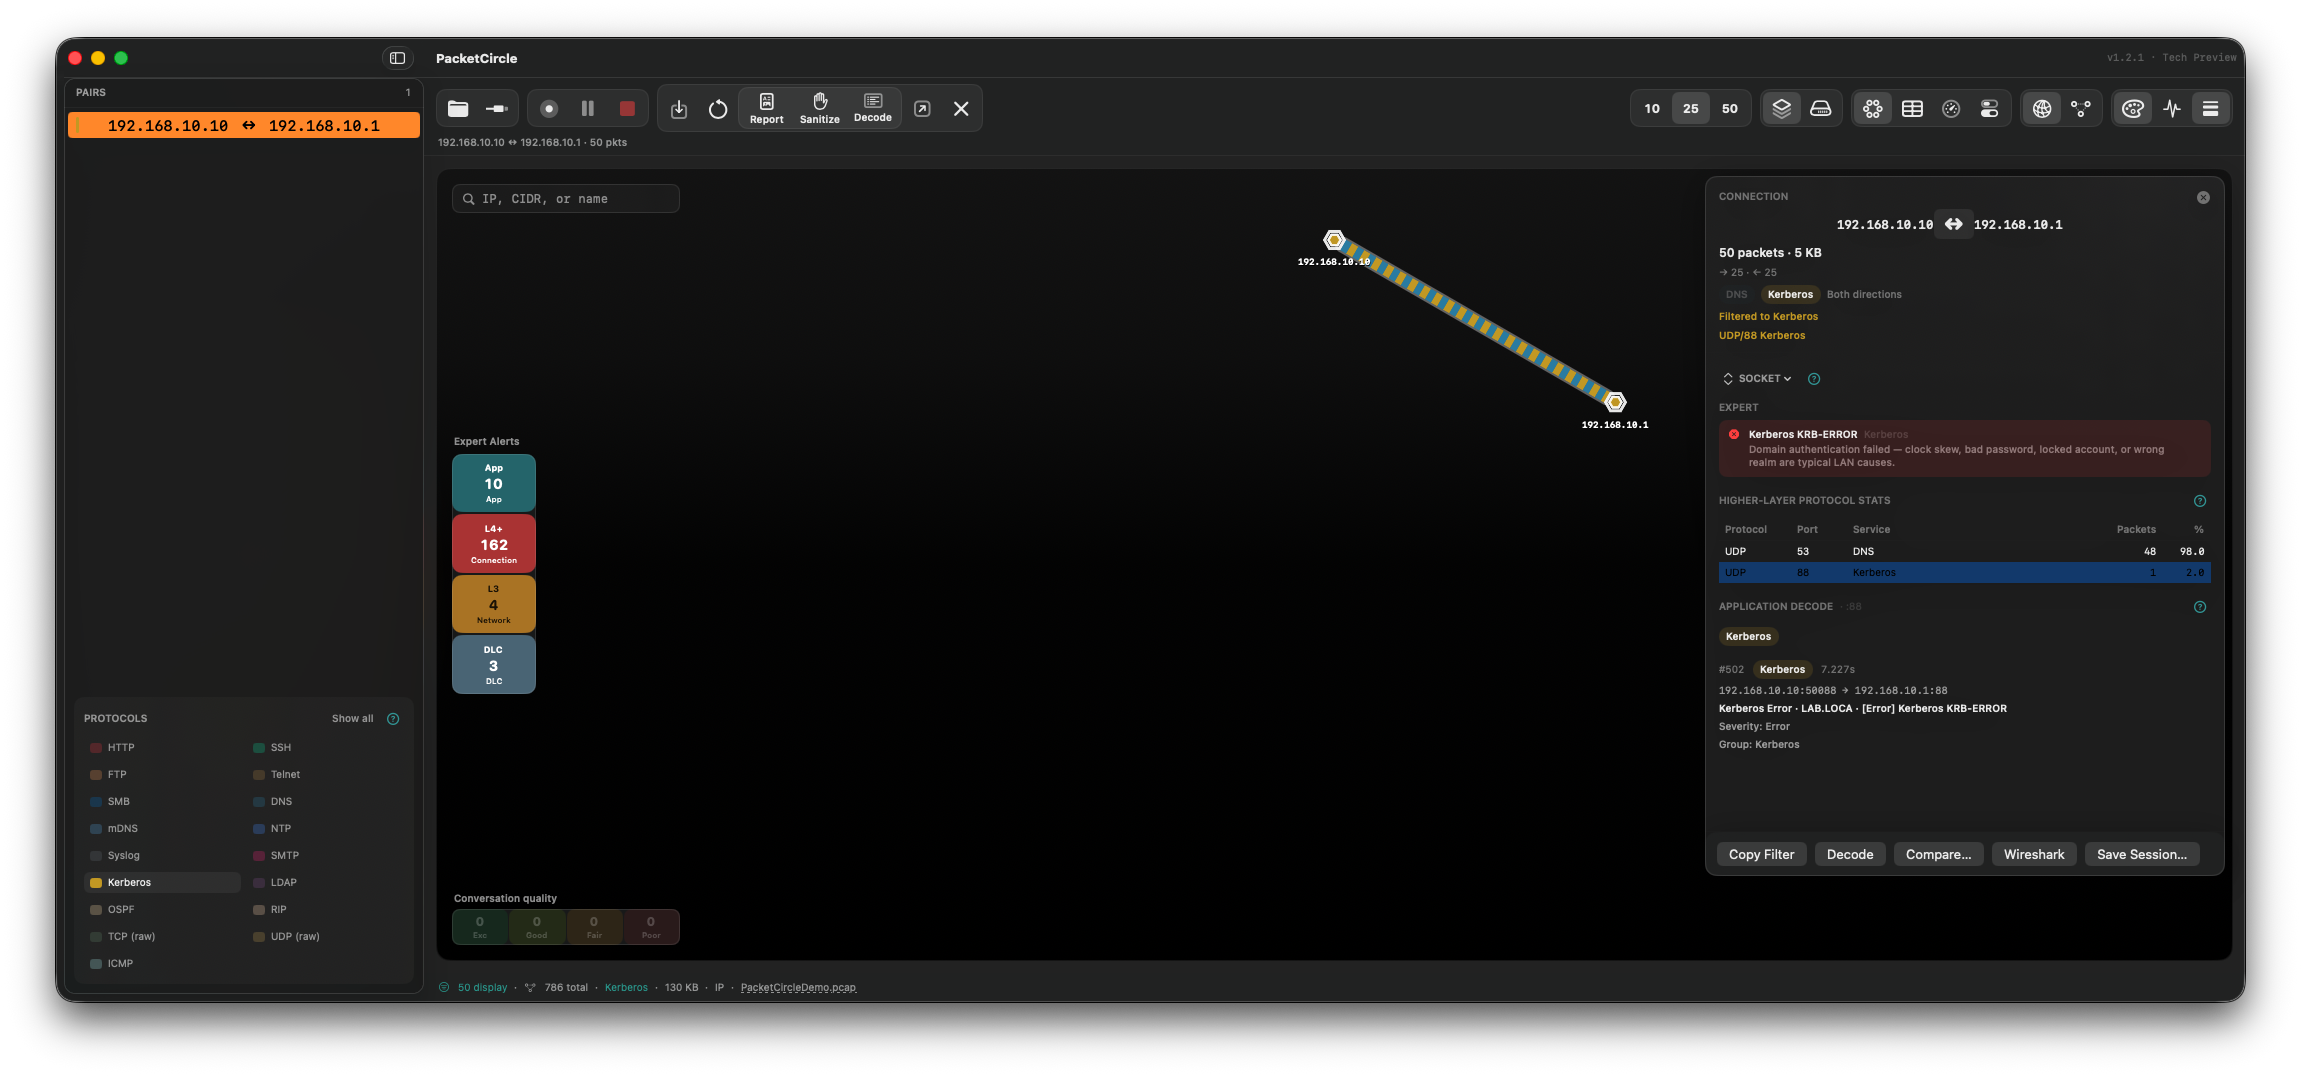
Connection details — Expert section with app / TCP findings.
16.4 Decode: Expert Info & TLS alerts
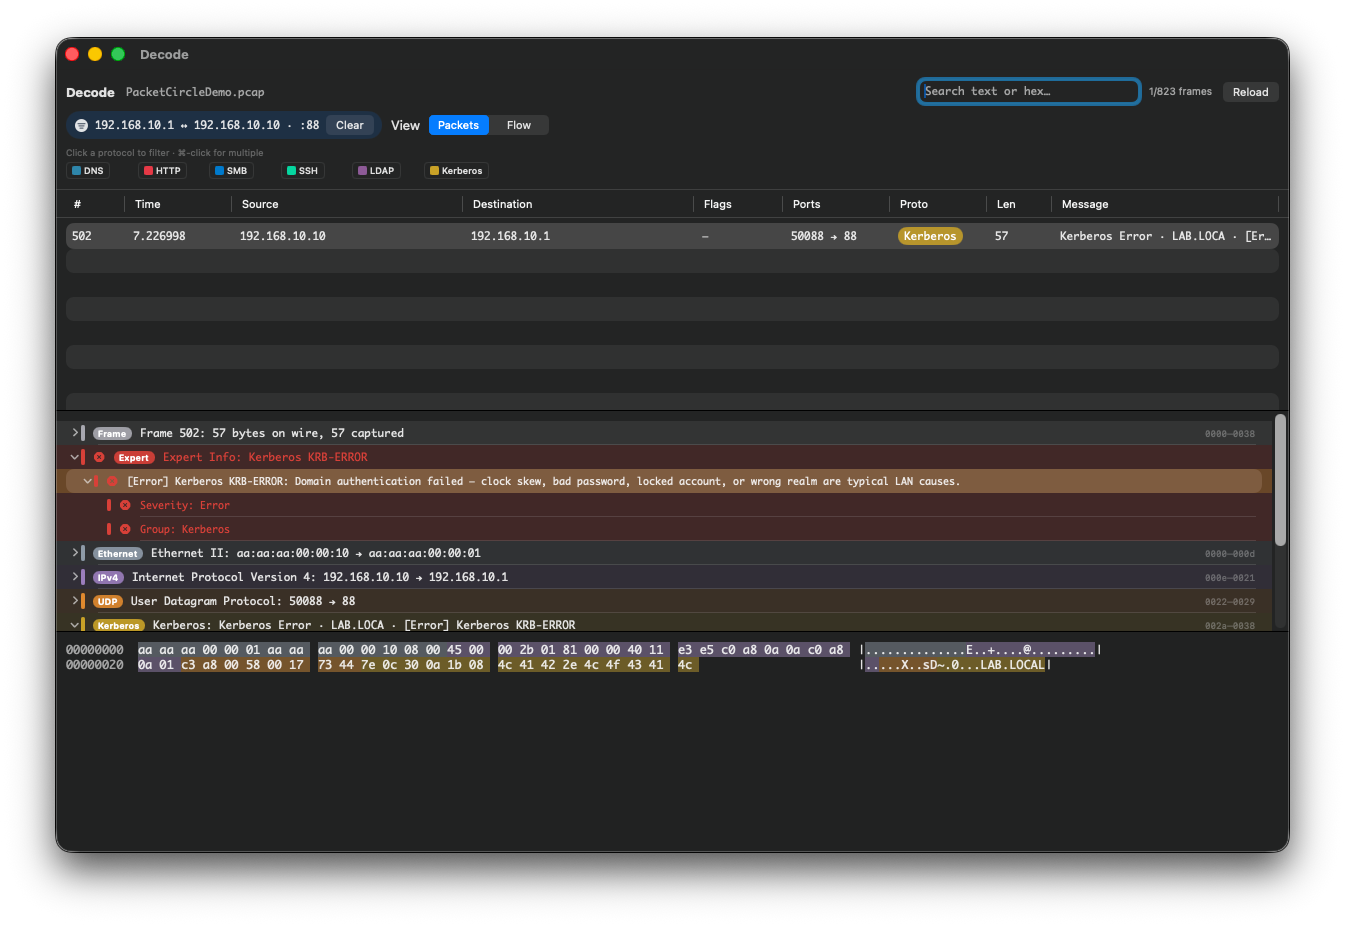
Decode window — Expert Info plus TLS Alert Meaning on a failing handshake frame.
Decode is a separate window (packet list · tree · hex). Per-frame Expert Info can appear at the top of the tree; parent layers may show severity badges.
TLS Alert records:
- Cleartext — level (warning/fatal), RFC description (e.g.
bad_certificate), and a short Meaning. - Encrypted / opaque — labeled as such (payload bytes after the cipher is active are not real level/description codes).
Suppressed Expert types are omitted from Decode annotations as well.
16.5 Settings
PacketCircle → Settings… panes include:
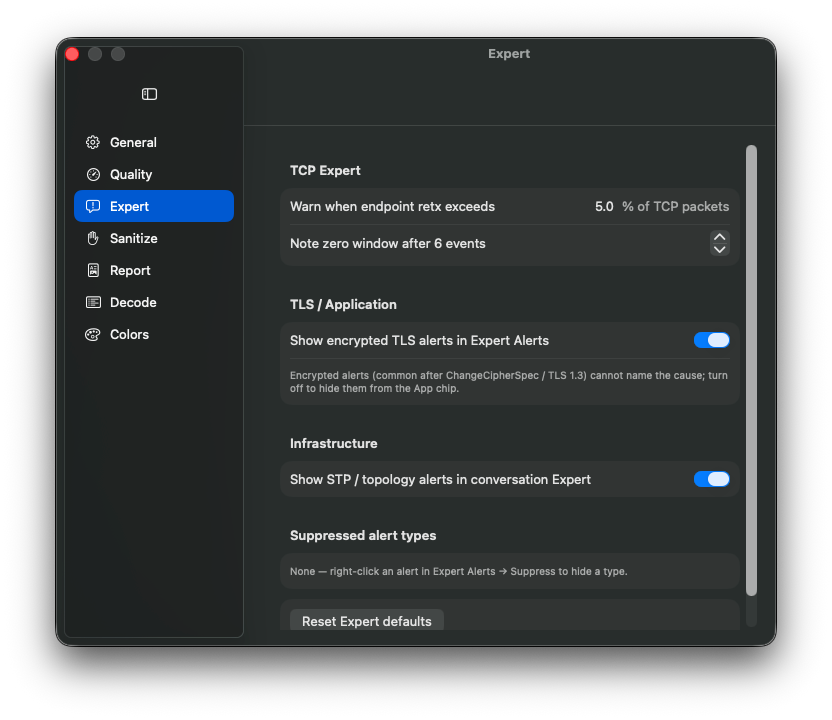
Settings → Expert — thresholds and suppressed alert types.
| Pane | Role |
|---|---|
| General / Quality | Host names, quality strictness bands |
| Expert | Retx % / zero-window thresholds; encrypted TLS alerts on the strip; STP in conversation Expert; suppressed alert types (Enable / clear all) |
| Sanitize / Report | Defaults for Sanitize Capture and PDF cover |
| Decode / Colors | Fonts, max frames, legend colors |
16.6 Sanitize Capture & Generate Report
- Sanitize Capture… — native streaming scrub (cleartext / all payload / payload + IP/MAC) with checksum fixups; write PCAPNG via the save panel. No Wireshark engine required.
- Generate Report… — multi-section PDF (file summary with SHA-256, charts, port/TCP analysis, optional annotated sidebars).
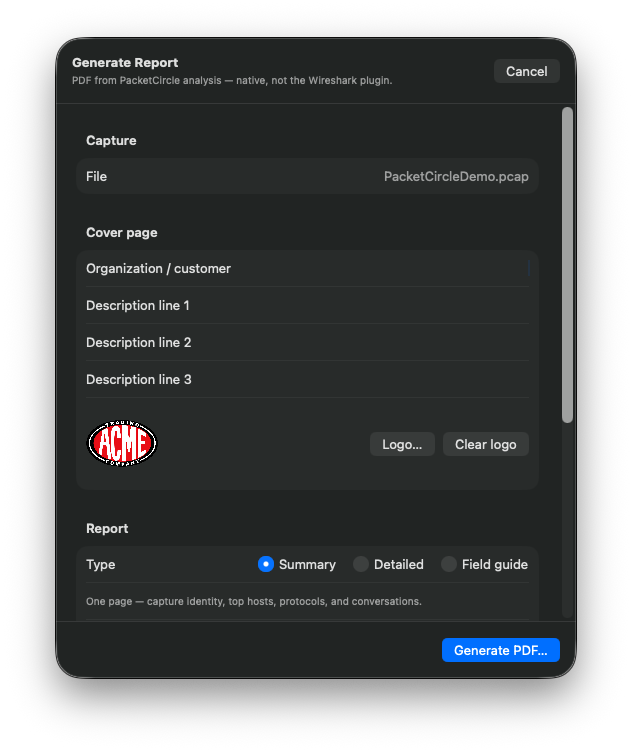
Generate Report — sample PDF output.
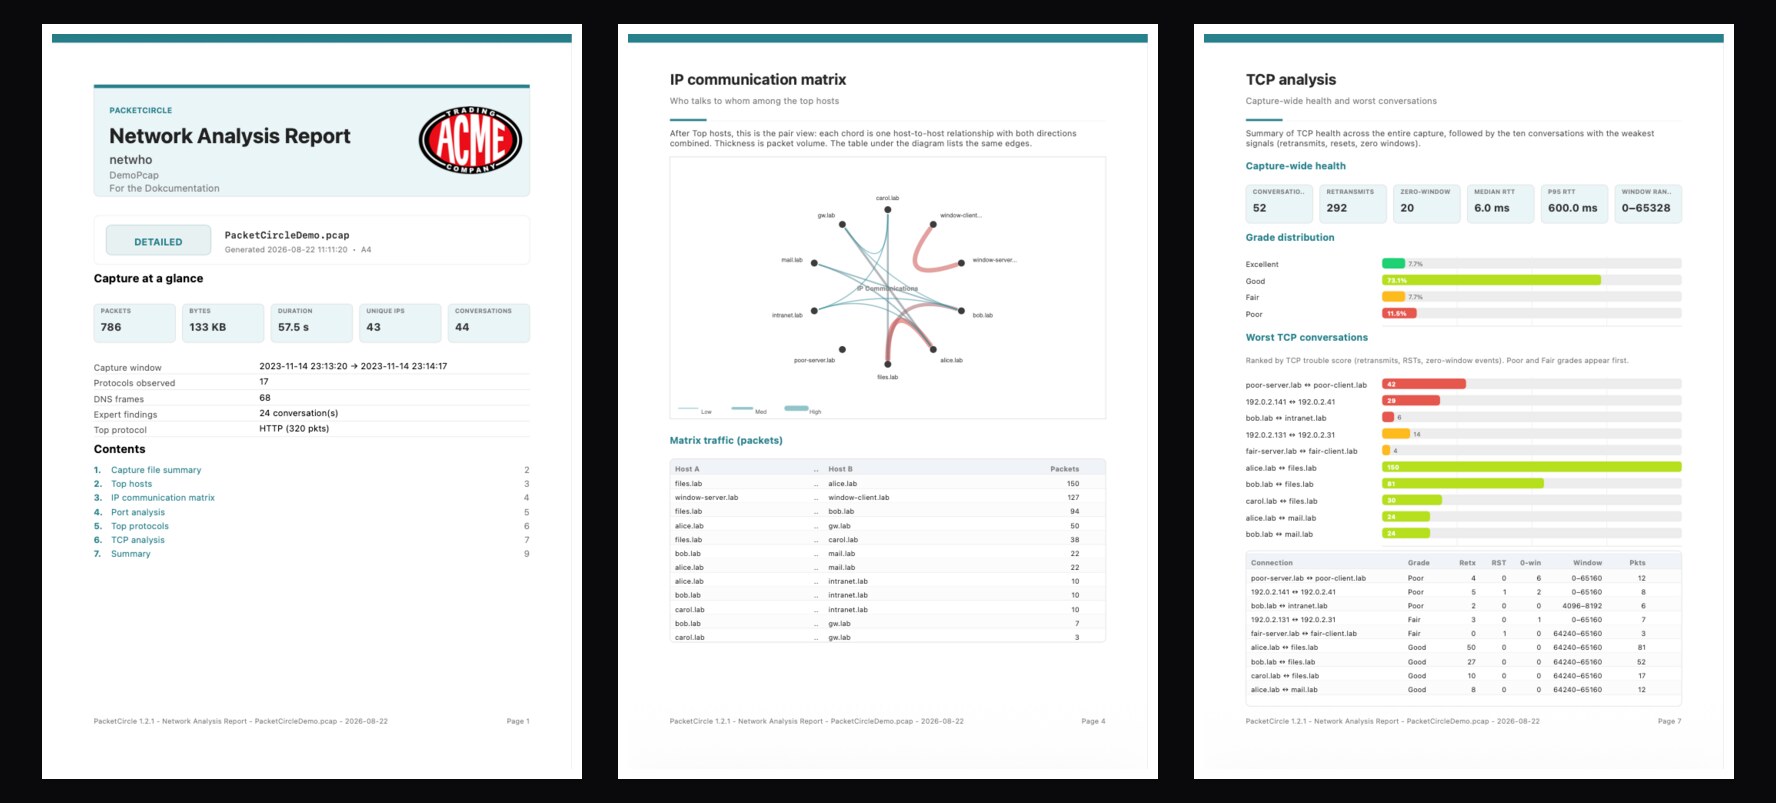
Example pages from a generated report: cover, IP communication matrix, TCP analysis.
16.7 Compare Conversations
Tools → Compare Conversations… (⇧⌘Y), or Compare… from Connection details. Side A is the reference; side B another edge or a second capture. The report covers MAC/IP (incl. TOS/DSCP), TCP setup, RTT, certificates, app/auth samples, and findings (RST, TLS alert, RTT gap, cert/SNI, auth).
⌘-click a second Circle edge first to pre-fill A and B.
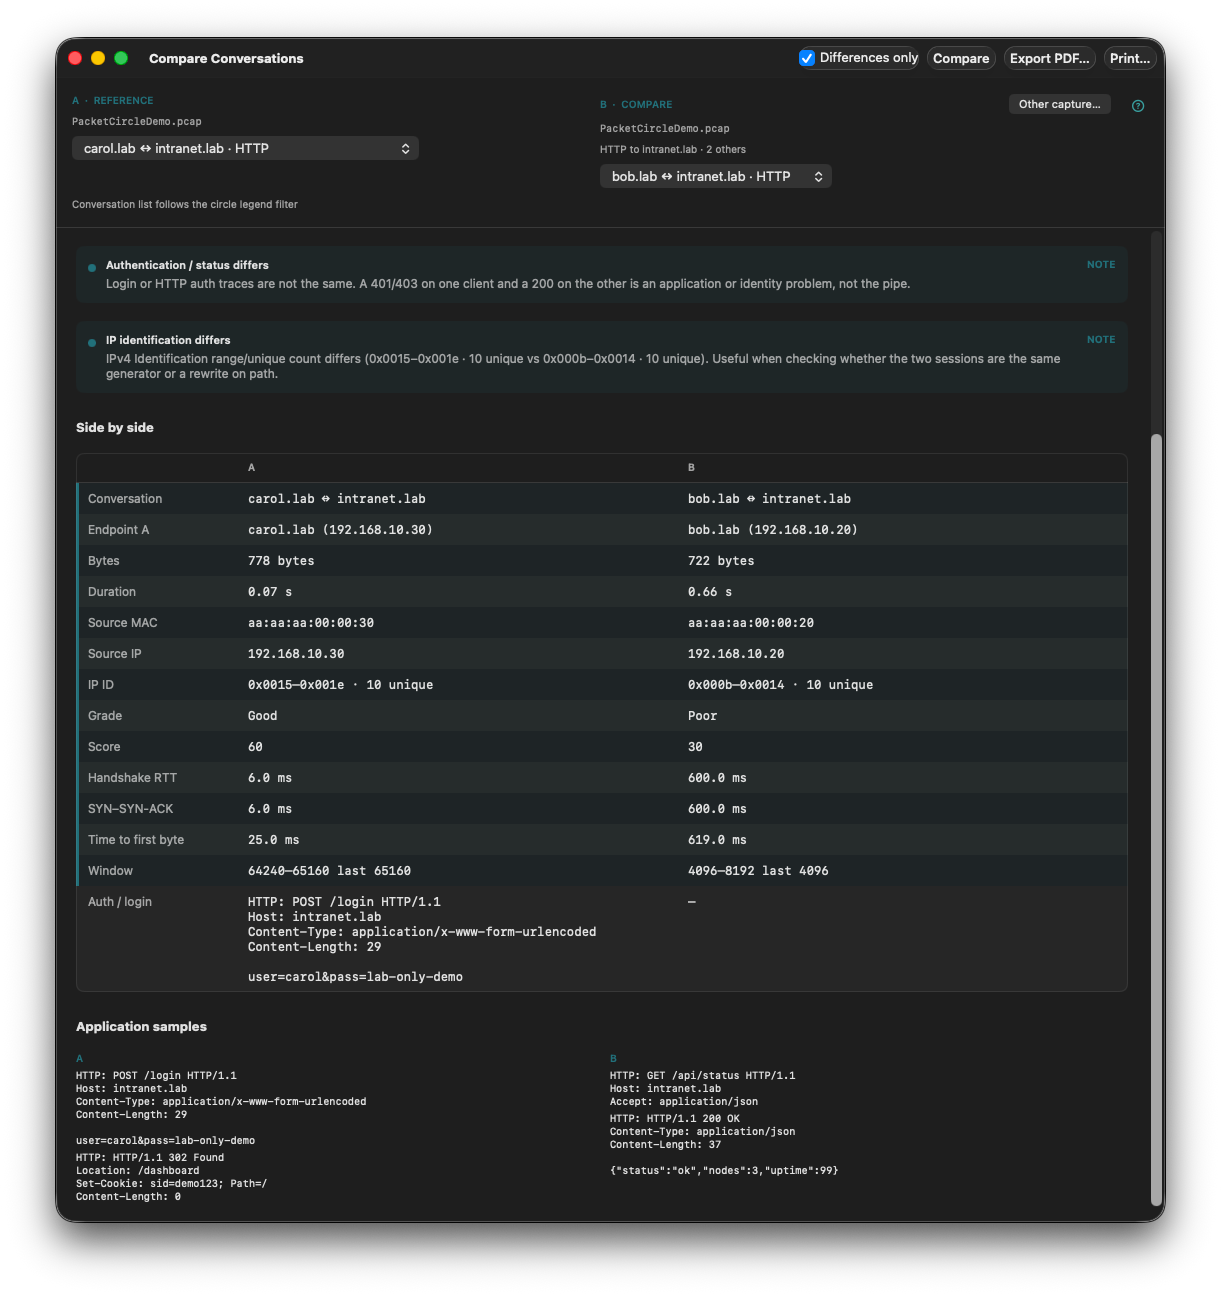
Compare Conversations — findings plus side-by-side table.
16.8 Topology Map
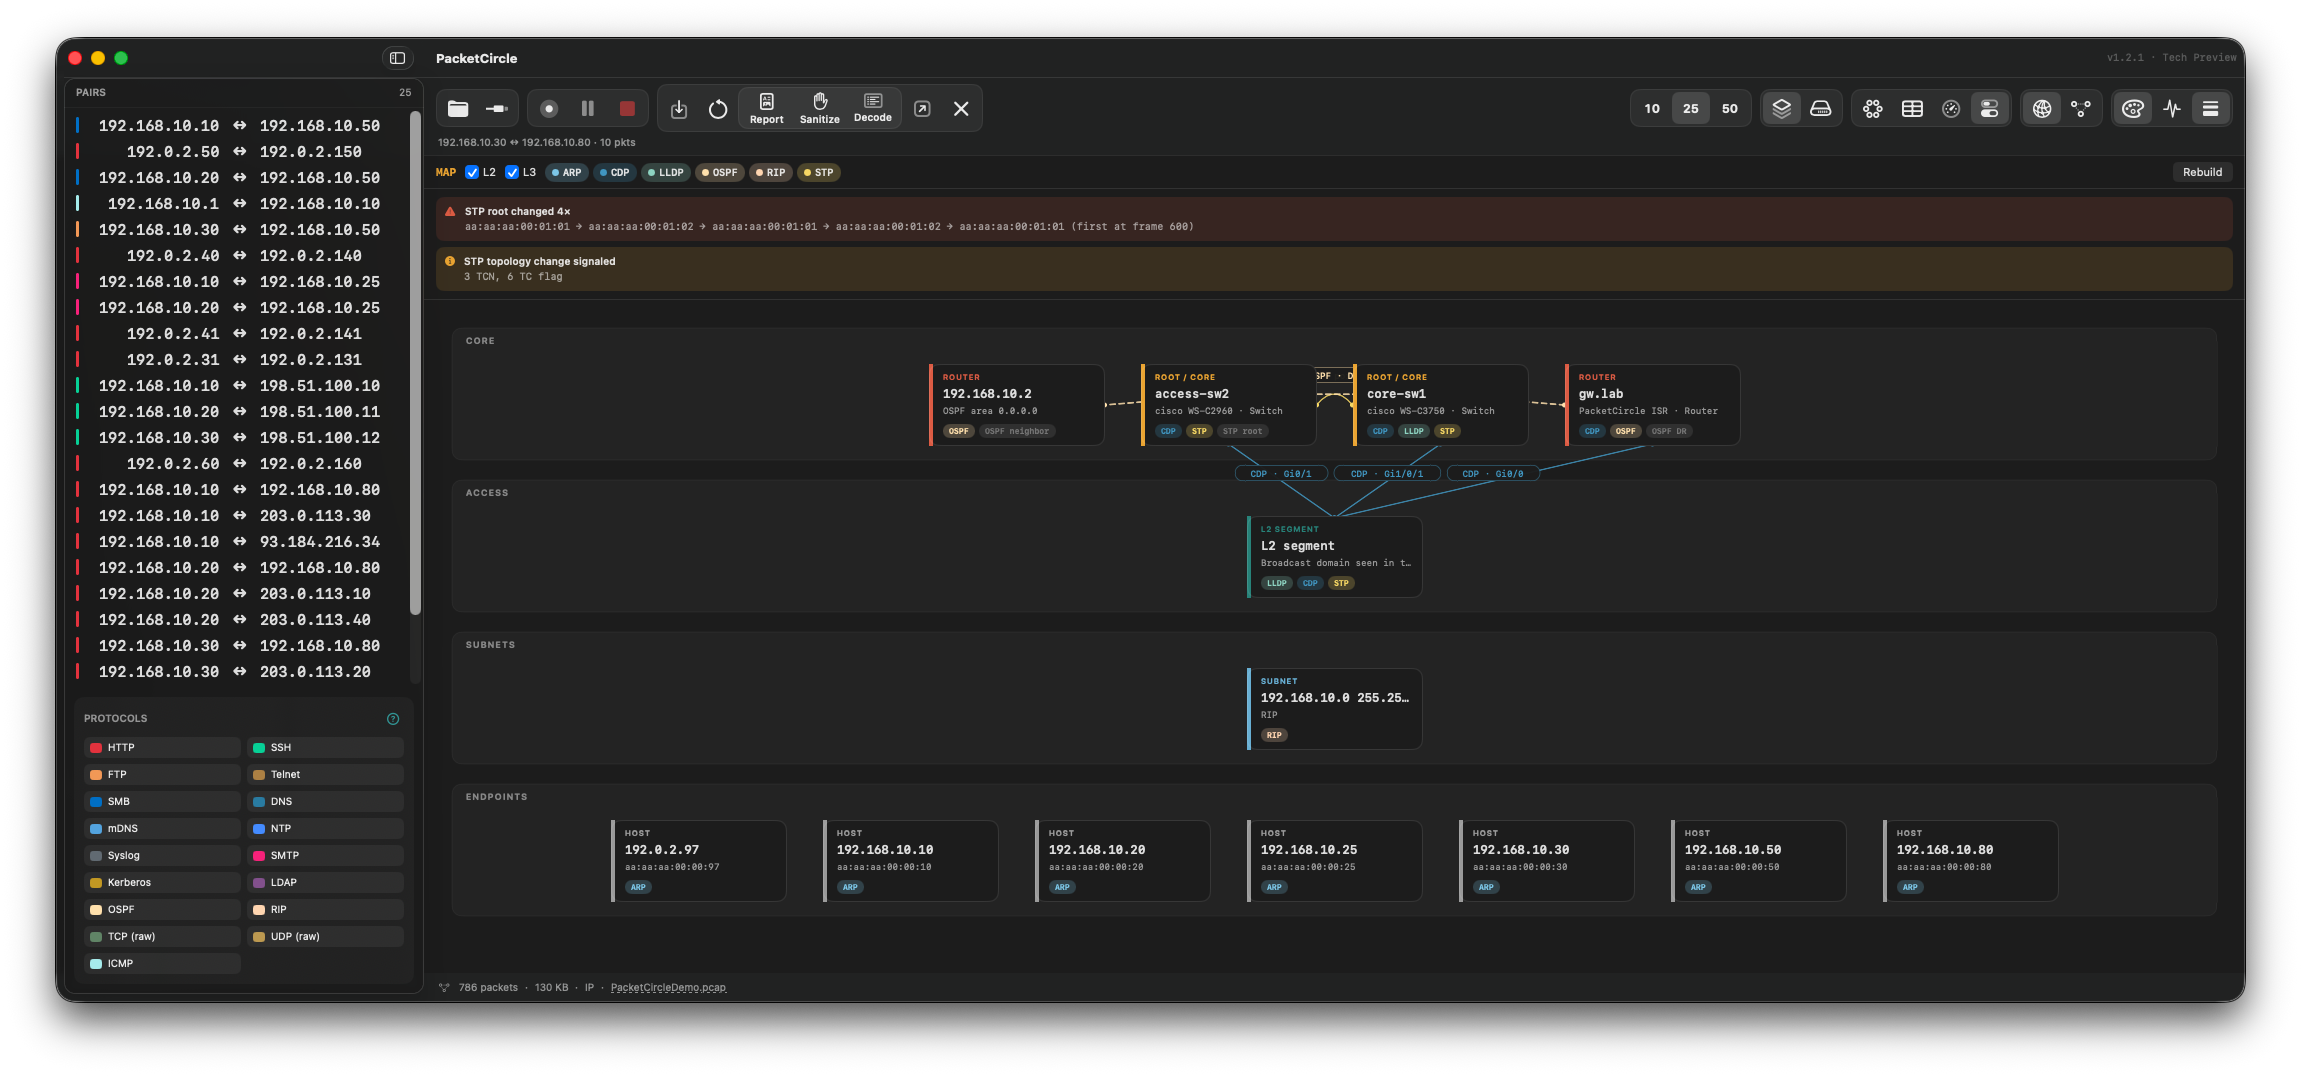
Map view with STP / topology context.
Map view walks L2/L3 relationships. STP root-change / TCN-style signals can appear under conversation Expert. Clicking a node opens Connection details (MAC mode when needed for L2).
16.9 Decode display filter (1.2.2)
Decode has a display filter next to search, using Wireshark syntax for the protocols and fields PacketCircle actually decodes: tcp, tcp.port == 80, ip.addr == 10.0.0.1, http and tcp.flags.syn, chained with contains, and/or/not. Autocomplete offers only names from PacketCircle’s own catalog — unsupported names (ospf, wlan, tcp.stream) turn the field red and leave the packet list unfiltered rather than silently matching nothing.
tcp.analysis.* covers the native per-frame experts raised elsewhere in the app: retransmission, spurious retransmission, ACKed unseen segment, zero window, duplicate ACK. This is PacketCircle’s own analysis, not Wireshark’s engine — tcp.stream and out-of-order detection remain unavailable.
16.10 Report Expert messages (1.2.3)
Generate Report’s Detailed and Field guide PDFs add an Expert messages section built from the capture-wide expert modules: type, description, counters, and sample nodes/pairs. Some findings are explicitly informational — present in the capture without proving a connectivity or performance problem (SPAN duplicates, traceroute TTL=1, jumbo frames, one-sided unanswered ARP, HTTP 404, encrypted TLS alerts, and similar).
16.11 Settings → Expert thresholds (1.2.3)
Settings → Expert (Mac; iOS Options) adds sliders for thresholds that vary by LAN:
| Threshold | Applies to |
|---|---|
| ARP storm warning / error (who-has per second) | Expert Alerts + report — immediately |
| Unanswered ARP retry count | Expert Alerts + report — immediately |
| Giant-frame size | Next time the capture is analyzed (raise on jumbo/storage fabrics) |
| Endpoint retransmit % and zero-window count | Expert Alerts + report — immediately |
16.12 ARP experts & Circle Expert mode (1.2.3)
Two new Expert Alerts: ARP request storm (who-has burst per second) and ARP unanswered (retried who-has with no reply anywhere in the file).
The Circle toolbar gains an Experts mode after Top 10/25/50: it shows conversations carrying warn/error Expert Alerts instead of only the busiest (capped at 250). Solo an Expert Alerts band first to restrict which layer it draws from.
16.13 Capture & decode depth (1.2.4)
IGMP / MLD decode — group addresses, v1/v2/v3 queries and reports (source lists, INCLUDE/EXCLUDE), well-known multicast labels (SSDP, mDNS, all-systems).
TLS on HTTP alt ports — HTTPS on 8080 / 80xx / 8888 is labeled TLS when the payload is a TLS record; plaintext HTTP on those ports still shows as HTTP.
PCAP over IP (client) — PacketCircle connects out to a remote pcap stream (TCP@host:57012), the same convention Wireshark uses with -k -i TCP@host:port. The phone or Mac never sniffs its own Wi-Fi or cellular traffic — the other side must already be sending a PCAP stream, for example from the pcapoverip broker or PolarProxy. See PacketTools → PCAP over IP for the broker link and a small diagram of how it fits together.
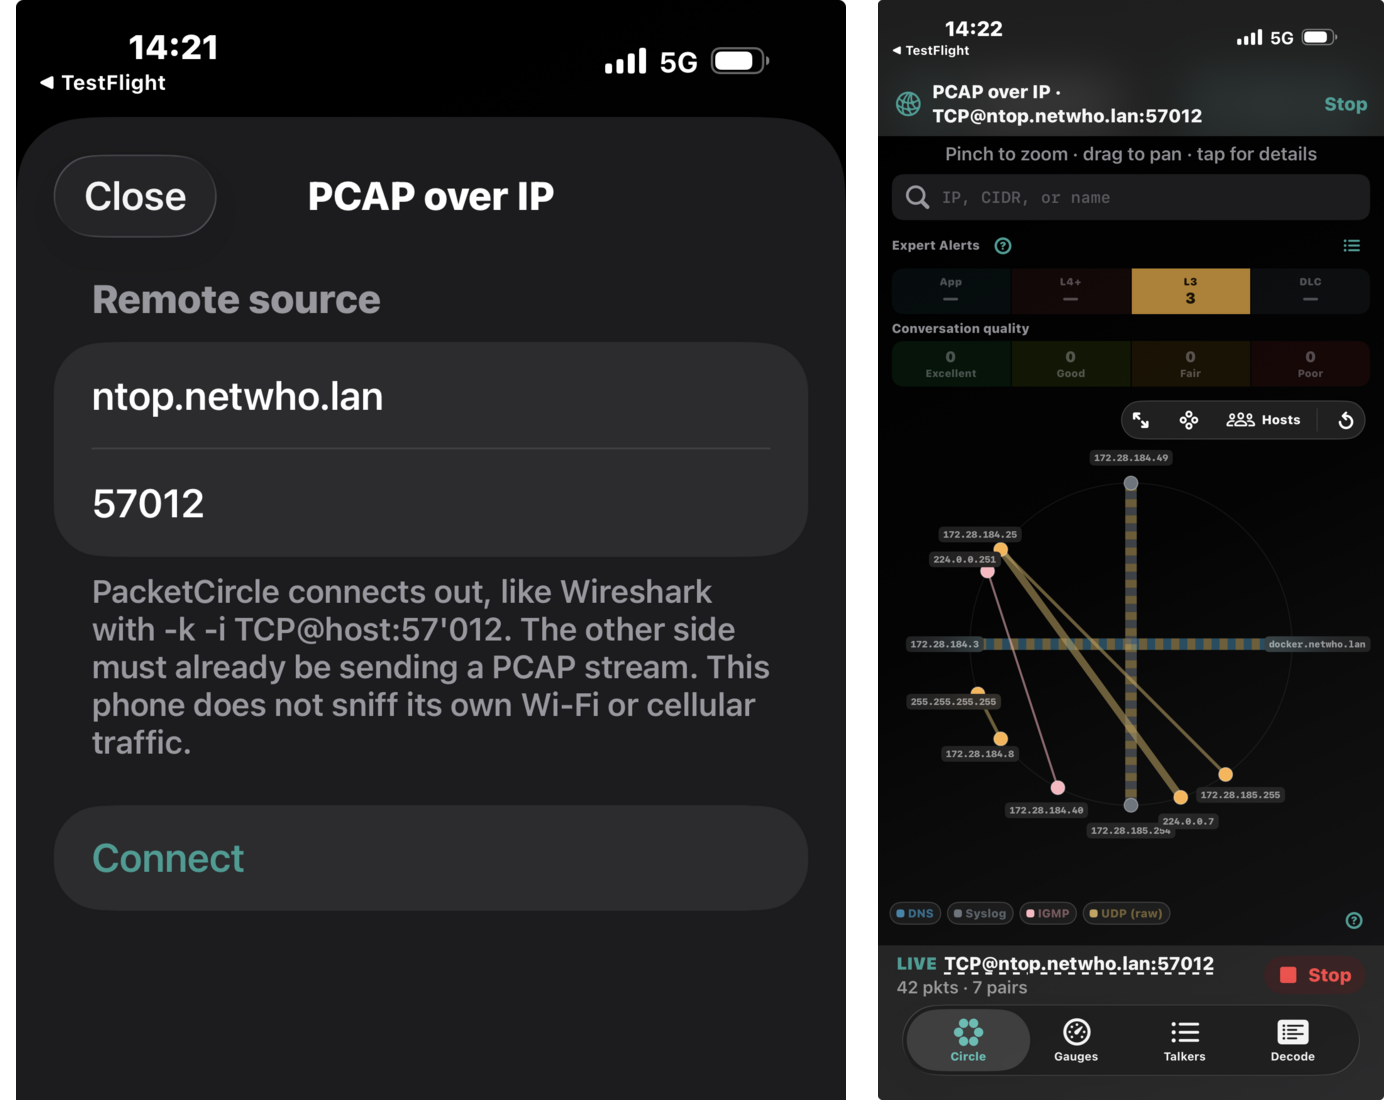
iOS PCAP over IP — connect sheet and the resulting live capture on the Circle.
Payload NetFlow / syslog — custom collector ports (e.g. UDP 515) classify from the datagram, not only IANA 2055/514.
Richer mDNS — Bonjour service types, cache-flush / QU, additional A/AAAA.
Fixed in 1.2.4: live PCAP-over-IP no longer re-analyzes the whole file every second or re-packs the Circle ring; iOS remote-connect failures no longer look like a Files import error (invalid host/port is shown in the sheet); Options → PCAP over IP waits for Options to dismiss before presenting the connect sheet.
16.14 NetBIOS and Windows browsing decode (1.2.5)
NetBIOS Name Service — queries, responses, name records and NBSTAT name tables; names also feed the host labels on Circle and Talkers.
NetBIOS Datagram and the Windows Browser protocol — \\MAILSLOT\\BROWSE host announcements and elections, shown in Decode and the Connection details Application preview.
Separate labels for NetBIOS-NS, NetBIOS-DGM and NetBIOS-SSN (ports 137–139) instead of one generic NetBIOS bucket.
16.15 Connection Expert follows the socket (1.2.6)
Viewing one socket (for example HTTP on port 80) now shows only that service’s Expert findings and TCP health, plus host-wide L3 / DLC findings — not FTP, mail, or other services’ alerts from the same pair of hosts.
A new Other sockets list at the bottom of Connection details switches between sockets in one click, with a warning marker on the ones that have alerts. Whole conversation is one click away.
The same finding on two services of one conversation (for example HTTP 404 on :80 and :8080) is now listed per socket instead of merged into a single Expert Alerts row.
16.16 More accurate Expert Alerts, smaller fixes (1.2.5)
Kerberos findings only fire on Kerberos traffic (ports 88 / 464) — no more false alarms on unrelated TCP streams.
Jumbo / giant frame findings are based on the real on-wire frame size, not a reassembly artifact.
Reset always returns the Circle to the IP view, even after filtering on link-layer (DLC) alerts.
Show host names is on by default for new installs.
17. What’s new in 1.3.x (Tech Preview)
1.3 is the first release built from the combined repository: one analysis engine written in Rust, with SwiftUI (Mac, iPhone, iPad) and a native Linux/Windows app as front ends. 1.3.2 (macOS build 126) is the current Mac build. Positioning is unchanged: not Wireshark, native analysis (not open source yet), no telemetry.
17.1 Rust core and speed
Opening and reloading a capture (PCAP, PCAPNG, gzip, Sniffer Pro), the conversation index, Decode, Follow TCP Stream, Compare facts, Sanitize and the incremental analysis of a growing live capture run in the Rust core. Moving the analysis out of Swift is what makes the difference: a 600 MB capture with 1.2 million frames: 1 min 7 s before, 5 s now (Full analysis). The Circle layout, quality charts, the Infrastructure Map build and the PDF drawing still run in Swift and behave as before.
| Behaviour | What you see |
|---|---|
| Conversation index | Connection details open instantly, even on huge captures; Decode shows the selected conversation or port wherever it sits in the file |
| Captures of 200 MB or more | The app asks for Light or Full analysis; a Full analysis of a selection (hosts or time slice) can follow a Light one |
| Progress | Conversations, applications and frames found so far, with Stop |
| Footer | Packets, bytes, file name and, when done, how long it took and whether it was Full or Light, e.g. analyzed (Full) 5.5s |
17.2 Expert Alerts page
A new display mode in the view-options bar (the speech-bubble icon next to Map) shows every finding in one place. Tiles for Link, Network, Transport, Application and All filter the list. Tile totals include notes, so a TTL = 1 finding counts under Network; the chips on the Circle still count warnings and errors only. Each list row has a band-colour bar; the side panel explains the selected finding.
| Tile | Band on the Circle strip |
|---|---|
| Link | DLC |
| Network | L3 |
| Transport | L4+ |
| Application | App |
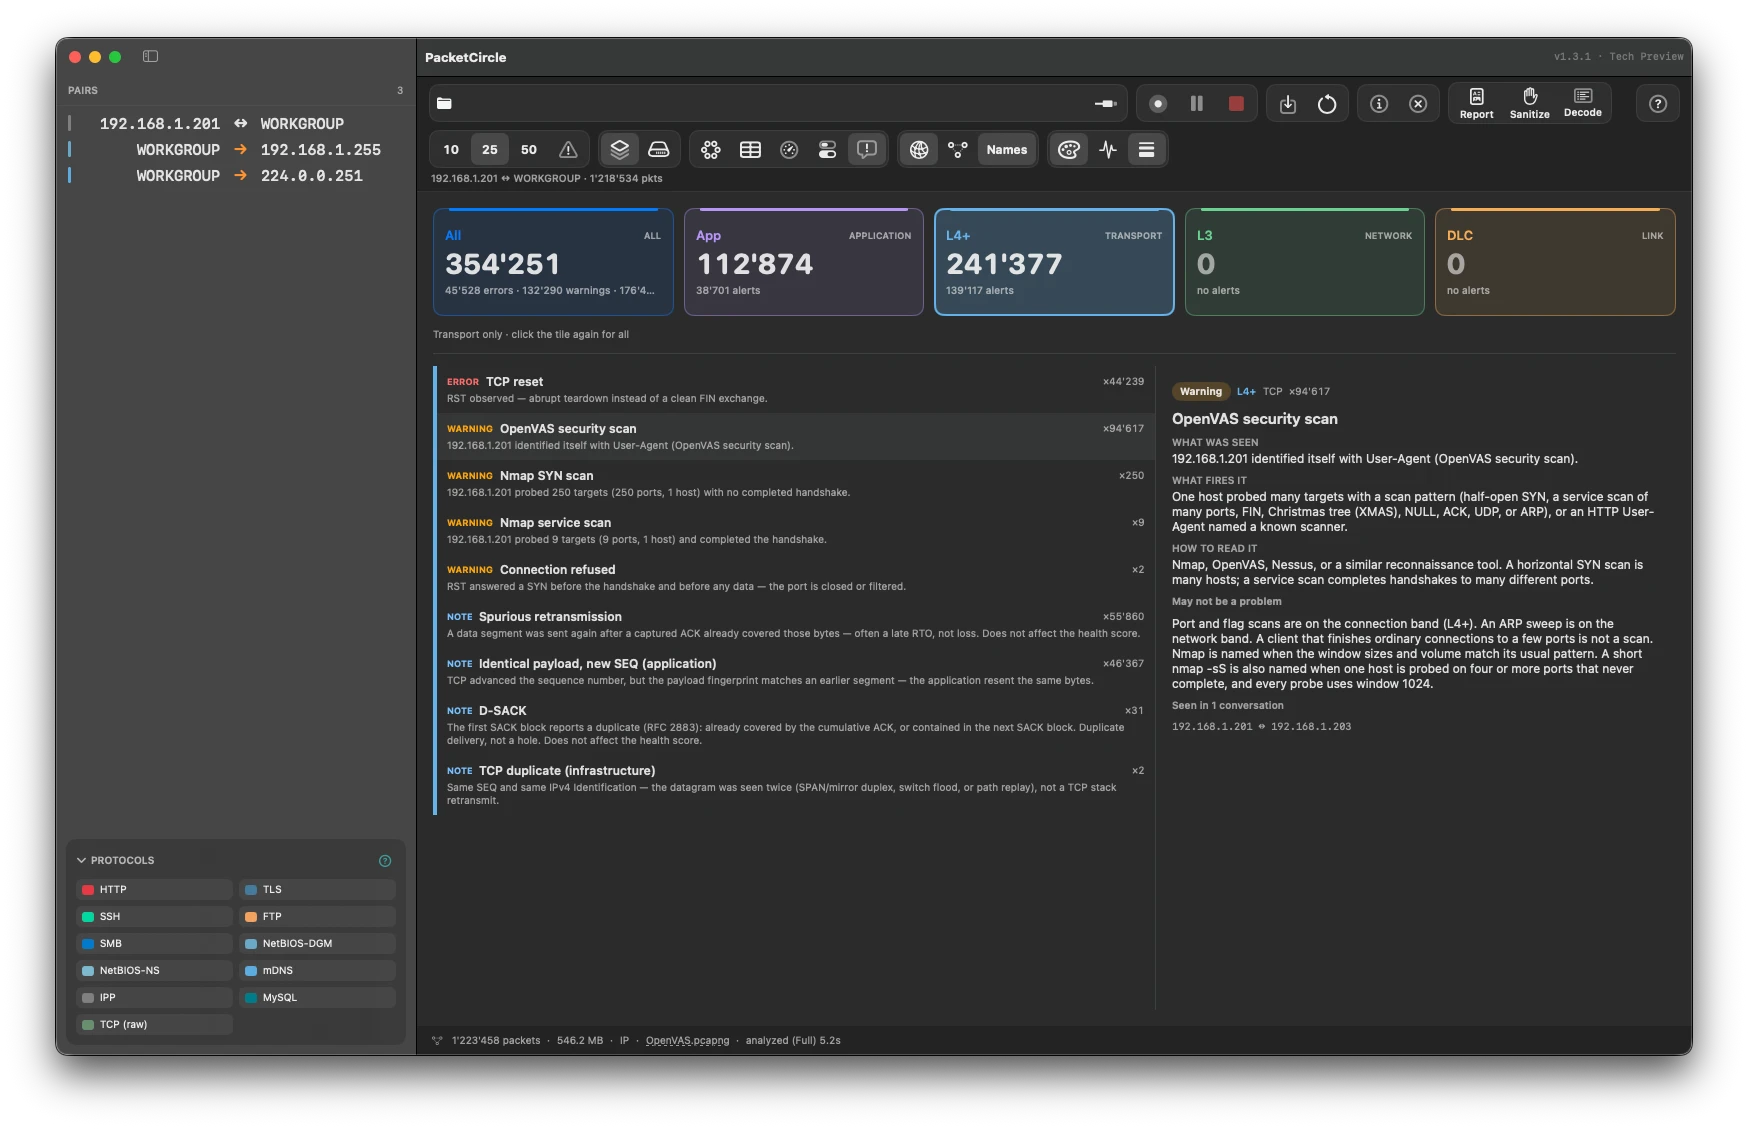
The Expert Alerts page: band tiles with counters (All, Application, Transport, Network, Link), the finding list with its band-colour bar, and the explanation of the selected finding. The footer shows the analysis time of this 546 MB capture with 1.2 million packets: 5.2 s (Full).
17.3 Gauges you can click
On the Gauges view, Hosts (by bytes or packets), Protocols (packet share) and TCP health (a grade or a counter) apply the Circle’s host, protocol or grade filter. Problem conversations sit beside the quality timeline; click one to open it.
17.4 Connection details
The header now shows endpoint blocks (name, address, MAC, port) and stat chips. Application messages are drawn as a two-lifeline sequence diagram; identical neighbours collapse to ×N. Copy capture filter gives a BPF filter for the pair, narrowed to tcp port or udp port when a socket is selected.
17.5 Pairs list, legend and host names
The protocol legend under the pairs list has a disclosure triangle and remembers whether it was open. Hovering a pair row or a chord highlights that chord and dims the others. Names now sits with the IP and MAC buttons and turns host names on and off; Settings no longer has that switch.
17.6 Sanitize on save, report logo
Save and Save Session ask whether to sanitize first; the answer is remembered for the session. In Settings → Report you can add your own logo (PNG or JPEG, up to 2 MB, stored in Application Support); it is drawn top-left on the PDF cover (at most 40 mm), with the PacketCircle mark as fallback.
17.7 Expert accuracy
Giant / jumbo frame findings now count the bytes actually stored in the capture. A larger PCAP “original length” left by a snaplen cut or by Linux GRO/GSO is not a jumbo frame: a 1514-byte frame (CRC not stored) stays under the 1518 threshold. Decode shows the claimed original length when it is larger than the stored frame. Raise the threshold in Settings → Expert on jumbo/storage networks.
17.8 Scan detector
Scans are now recognised and named in the Expert findings:
| Scan | Where it shows |
|---|---|
| Half-open SYN, service, FIN, Christmas-tree, NULL, ACK, UDP and User-Agent scans | Warnings on the connection band (L4+) |
| ARP sweep | Network band (L3) |
Nmap is named when the time window and the volume match. The demo capture contains one Nmap SYN scan (ports 22, 80, 443, 8080) and one Christmas-tree scan (FIN+PSH+URG on ports 21, 23, 25, 110, 143) — open Demo Mode and look at the Expert Alerts page.
Scan findings: the OpenVAS User-Agent scan, an Nmap SYN scan and an Nmap service scan are warnings on the Transport (L4+) band; the panel on the right explains what fires the finding and how to read it.
17.9 PacketCircle on Linux and Windows
The same engine powers a native app for Linux and Windows (a signed Windows installer since build 128). It has its own manual: PacketCircle Linux and Windows — User Manual.
17.10 Appearance and Expert search (1.3.2)
Appearance: Settings has a Dark / Light / System choice (iPhone: Options). System follows the macOS appearance; Dark or Light forces one regardless of the desktop. The Circle and the Infrastructure Map stay black in both; text, icons, lists and charts are adjusted so they stay readable in light mode.
Expert search: type expert followed by a group or message into the Circle’s search bar to find Expert findings; the Circle page of Help explains the syntax.
Connection card: a conversation with TCP quality, more than one socket or Expert findings now uses the full height of the Circle, with the same margin at the top, right and bottom, and follows the window size.
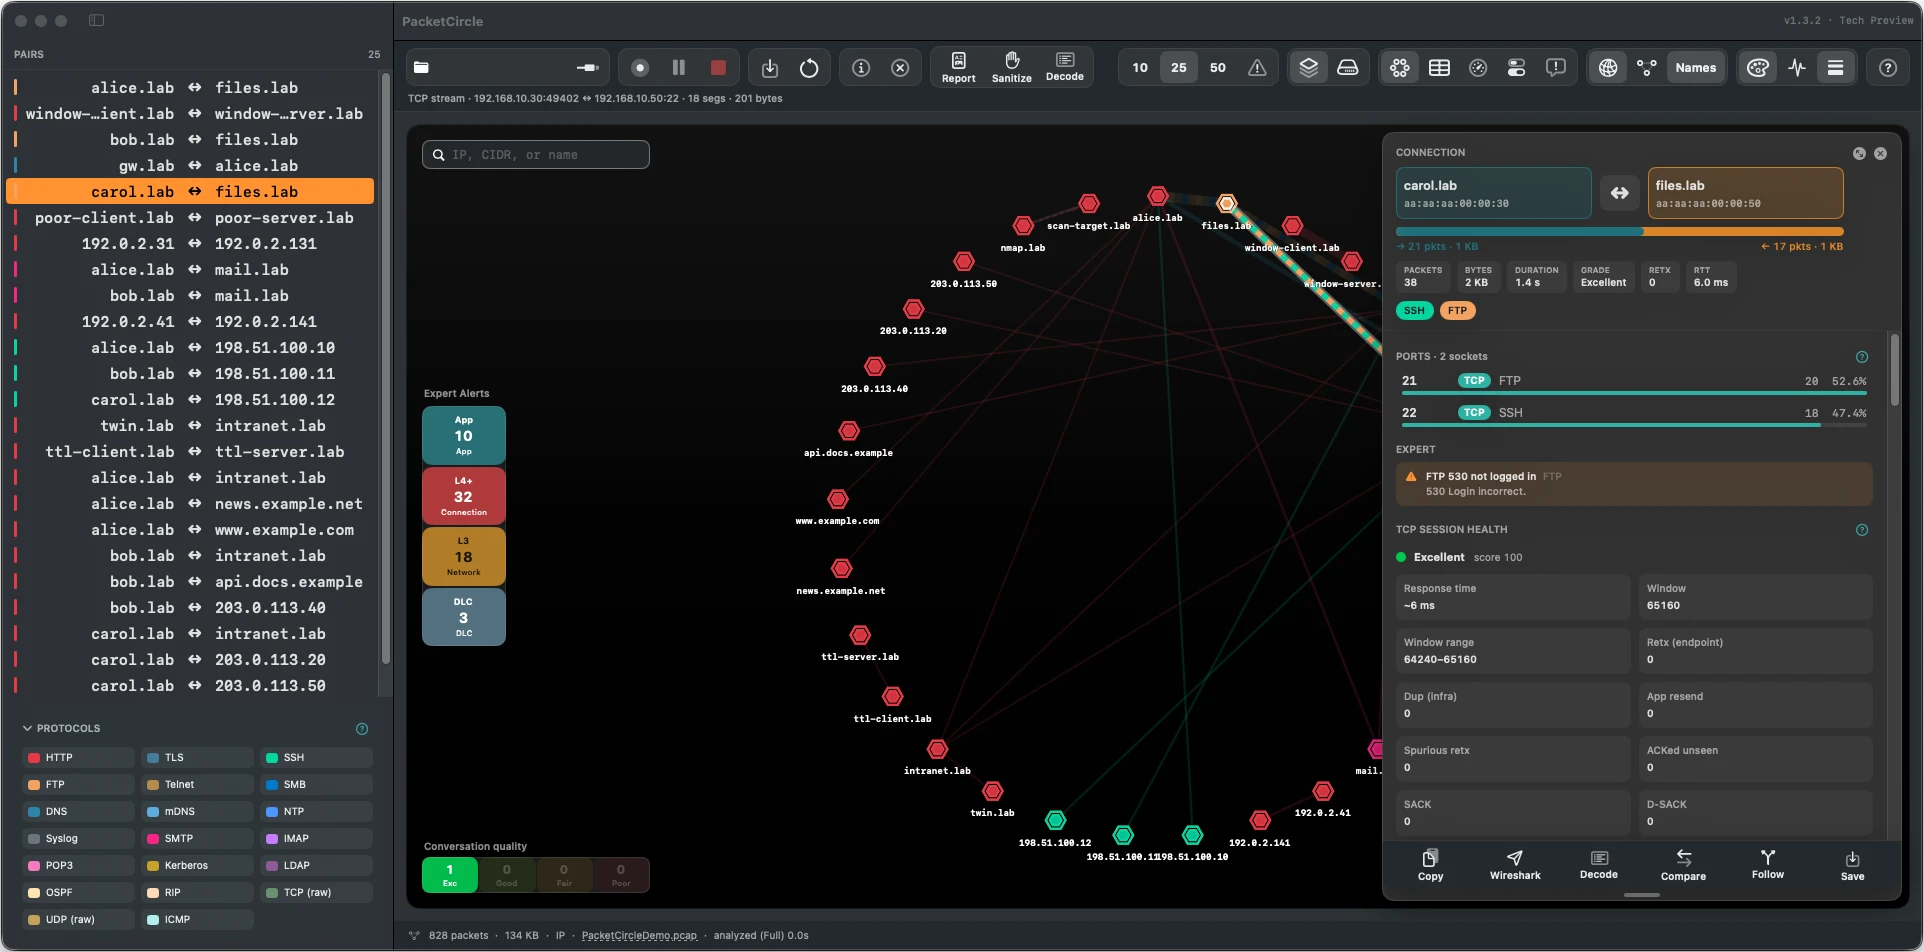
Dark appearance: the pairs list, toolbar, Expert Alerts strip and the connection card follow the dark theme. The Circle itself is black in both appearances.
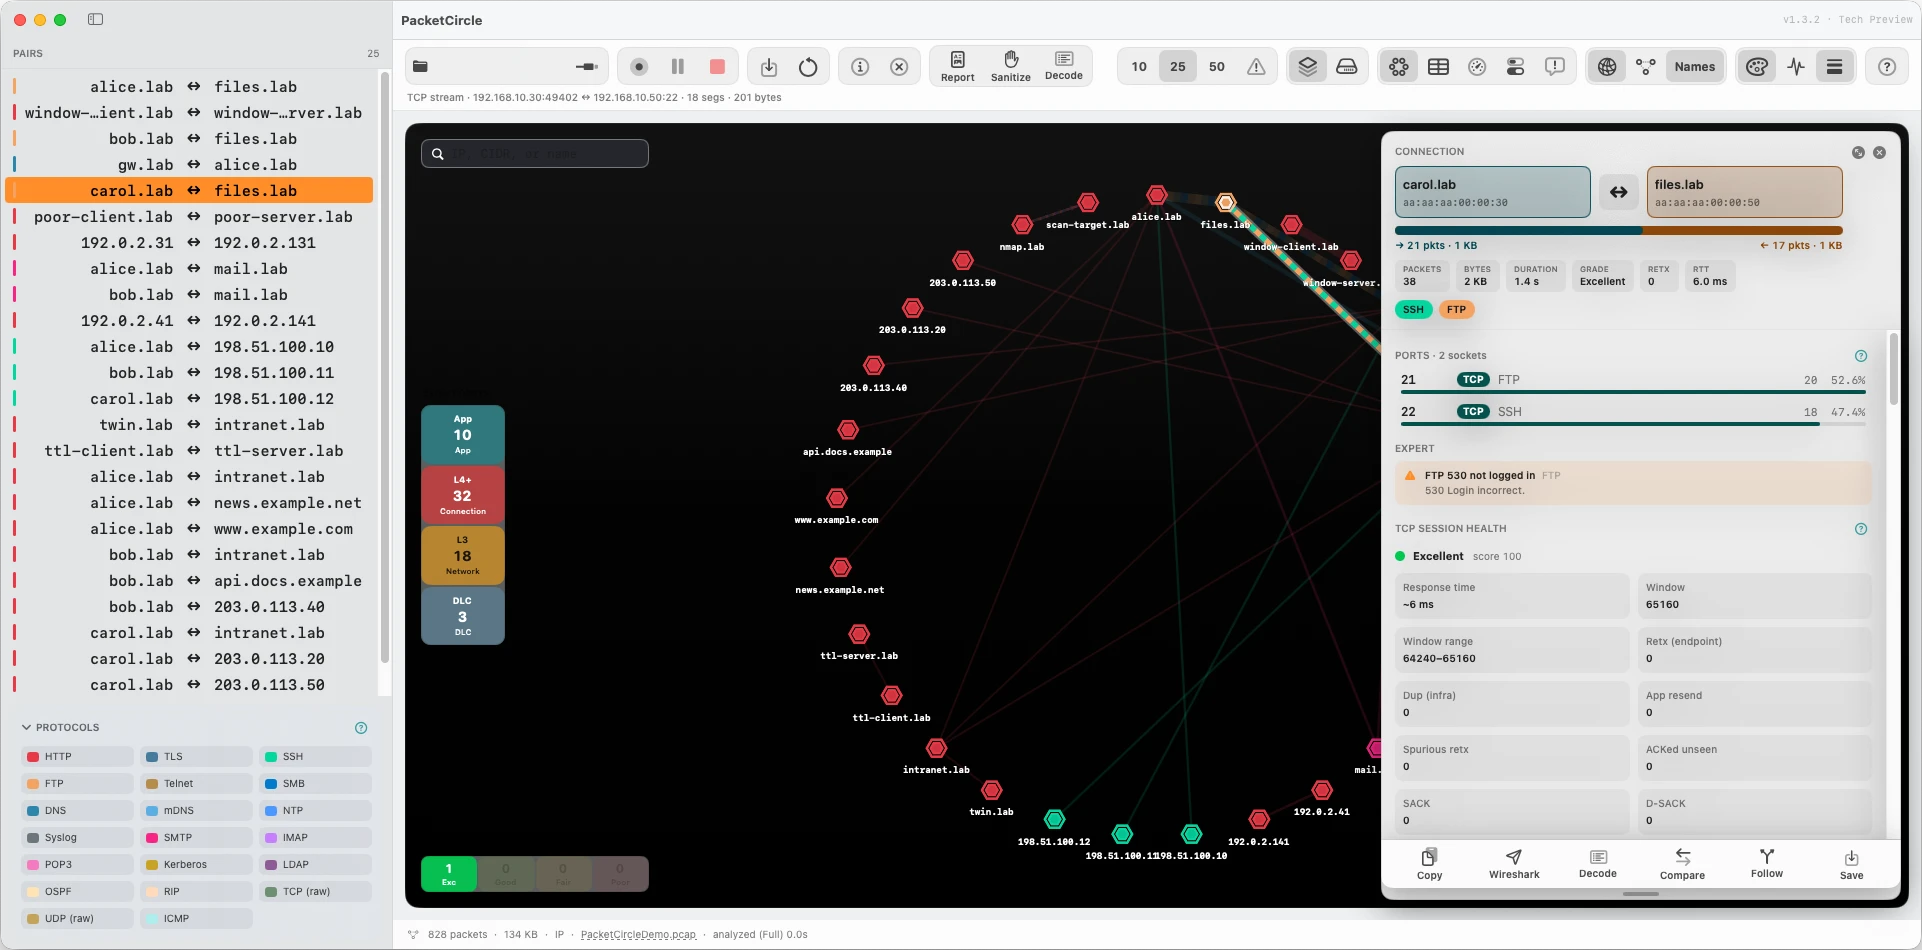
Light appearance: the same window with a light list, toolbar and connection card. The Circle and the Infrastructure Map stay black; the text and icons drawn on them are adjusted to stay readable.