PacketCircle for iPhone: your PCAPs as a circle, in your pocket, for free
Native Swift. Offline PCAP/PCAPNG. No ads, no subscriptions, no telemetry — and yes, no live sniffing (I’ll explain why).
It (still) starts with a circle
I have a mildly unreasonable love for one idea: draw network conversations as a circle. Who talks to whom, which protocols, which edges run hot. Last year that turned into PacketCircle, an open-source Wireshark plugin. The mental model never let go of me — once you see traffic as a ring of relationships, packet lists feel like reading a phone book to find a party.
So this is less “startup” and more “the itch came back.” I wanted the circle on the one screen that’s always in my pocket.
The confession up front: this is a learning project
I’m not a “real” developer. I pay the bills as a consultant, and I’ve had an Apple Developer account for years — used almost entirely to wrap and sign other people’s apps for MAM/MDM distribution. Never to actually build something. PacketCircle for iPhone was my excuse to finally get my hands dirty with Xcode, Swift and SwiftUI.
And like most of my side projects: yes, this one is AI-assisted. I built it with Cursor riding shotgun. I’m not going to be coy about it — and I’m not undervaluing writing the code either. Getting a native app to compile and behave is real work. What still eats the calendar, though, is the stuff AI can’t invent for you: information modeling and visualization that fits a small screen — which metrics belong on the circle vs. in Session details, how TCP health should read at a glance, what a thumb-sized workflow looks like when you’re actually troubleshooting. If you don’t understand the metrics representation and the analyst’s path through the UI, you just get a pretty toy. I hope people really find PacketCircle useful — more than a toy. 😉
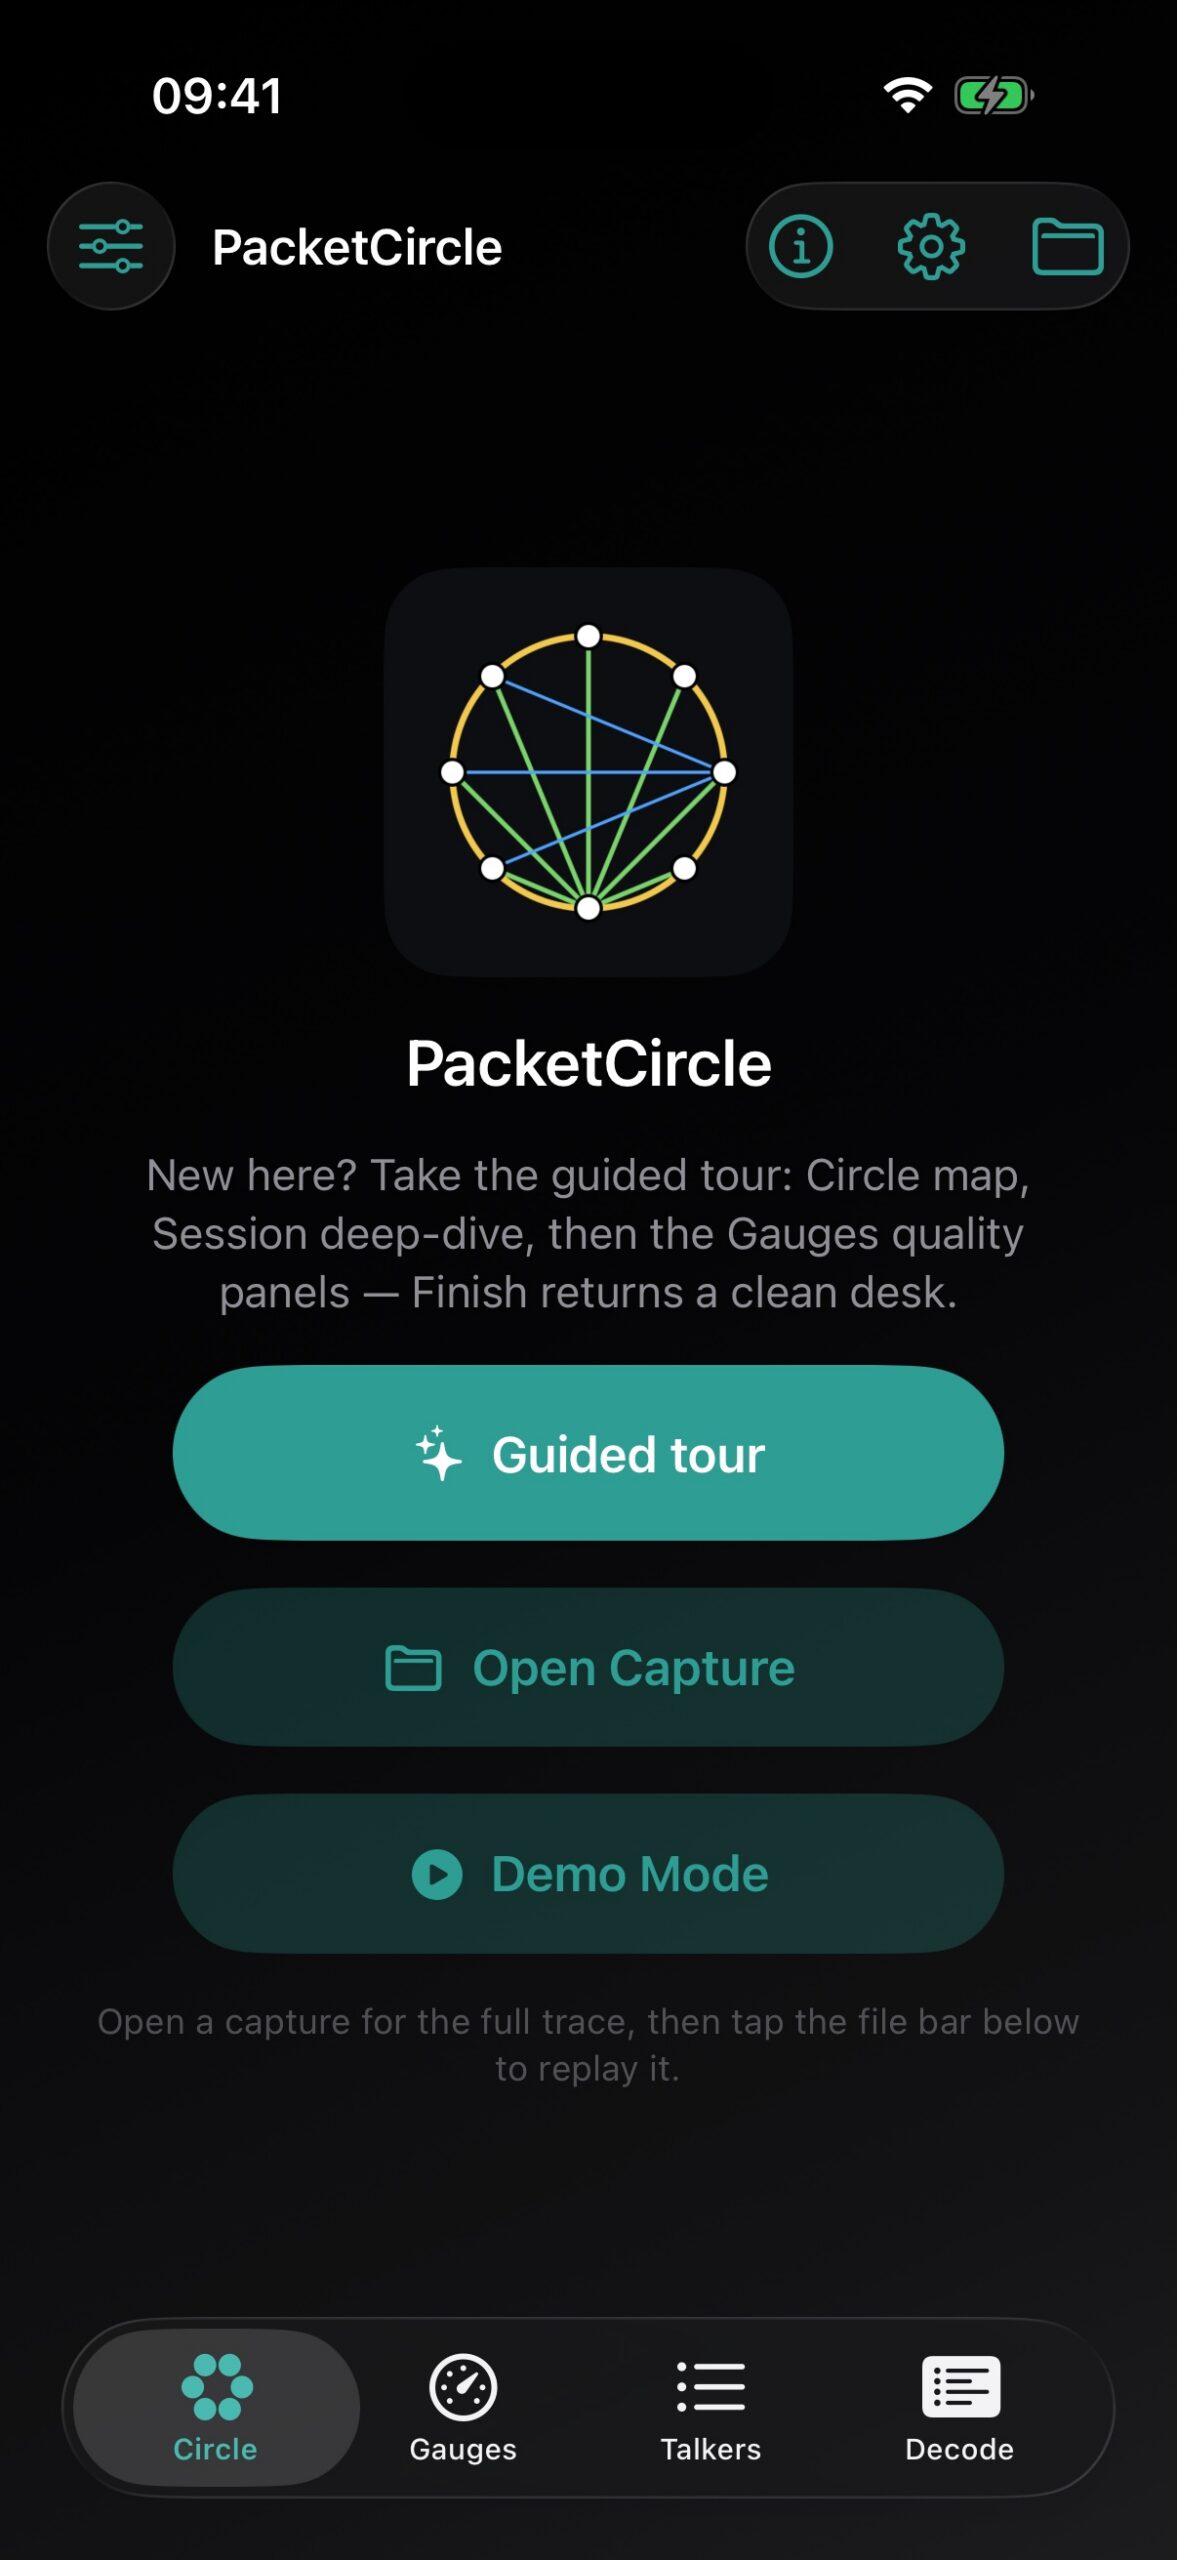
Home screen — Guided tour, Open Capture, Demo Mode.
The deal (this is the part I actually care about)
Because I’m tired of opening the App Store and finding a flashlight that wants a subscription and my location data, here’s the whole contract for PacketCircle on iPhone:
- Free. Not “free trial.” Free.
- No ads.
- No in-app purchases. Nothing is locked behind a paywall.
- No telemetry. I don’t phone home. I don’t want your data — honestly, keeping it would just be a liability.
- 100% offline. Put PCAPs in your iPhone storage (Files / AirDrop / share sheet) and it works with the network turned off entirely.
Why free? The honest answer: I don’t need PacketCircle to pay rent — consulting does that. The slightly grumpier answer: the App Store is drowning in subscriptions, ad SDKs and data lakes, and I wanted to drop one small thing into it that’s just… a tool. If it saves you ten minutes, buy me a coffee and send good karma — I’m good. ☕
Why the App Store at all (and why there’s no open-source inside)
For an iPhone app that normal humans can actually install, the App Store is basically the only reasonable door. Sideloading and enterprise tricks aren’t a real distribution story for a tool like this. So App Store it is — which shaped two decisions:
- No local Wi-Fi/interface capture on iOS. You can’t sniff the Wi-Fi/interface from a sandboxed App Store app, and the VPN/tunnel “cheats” people whisper about won’t survive review anyway. PacketCircle stays honest about that: it’s an analyzer for captures you already have — plus, since 1.2.5, a live PCAP over IP stream you pull in from a sensor you control. The phone still never touches its own Wi-Fi or cellular traffic.
- No open-source dissection code shipped. The original plugin lives in GPL land. Mixing GPL v2 with App Store distribution is a famous legal rabbit hole, and I’ll admit it plainly: I haven’t chased down every detail. So instead of guessing, I removed the temptation entirely — no libwiretap, no borrowed GPL dissectors. The iOS app is clean, native Swift end to end. Less code coverage than Wireshark, sure, but zero license landmines.
The upside of that constraint: the decodes are mine, they’re limited on purpose, and I can put them on the Store with a clear conscience.
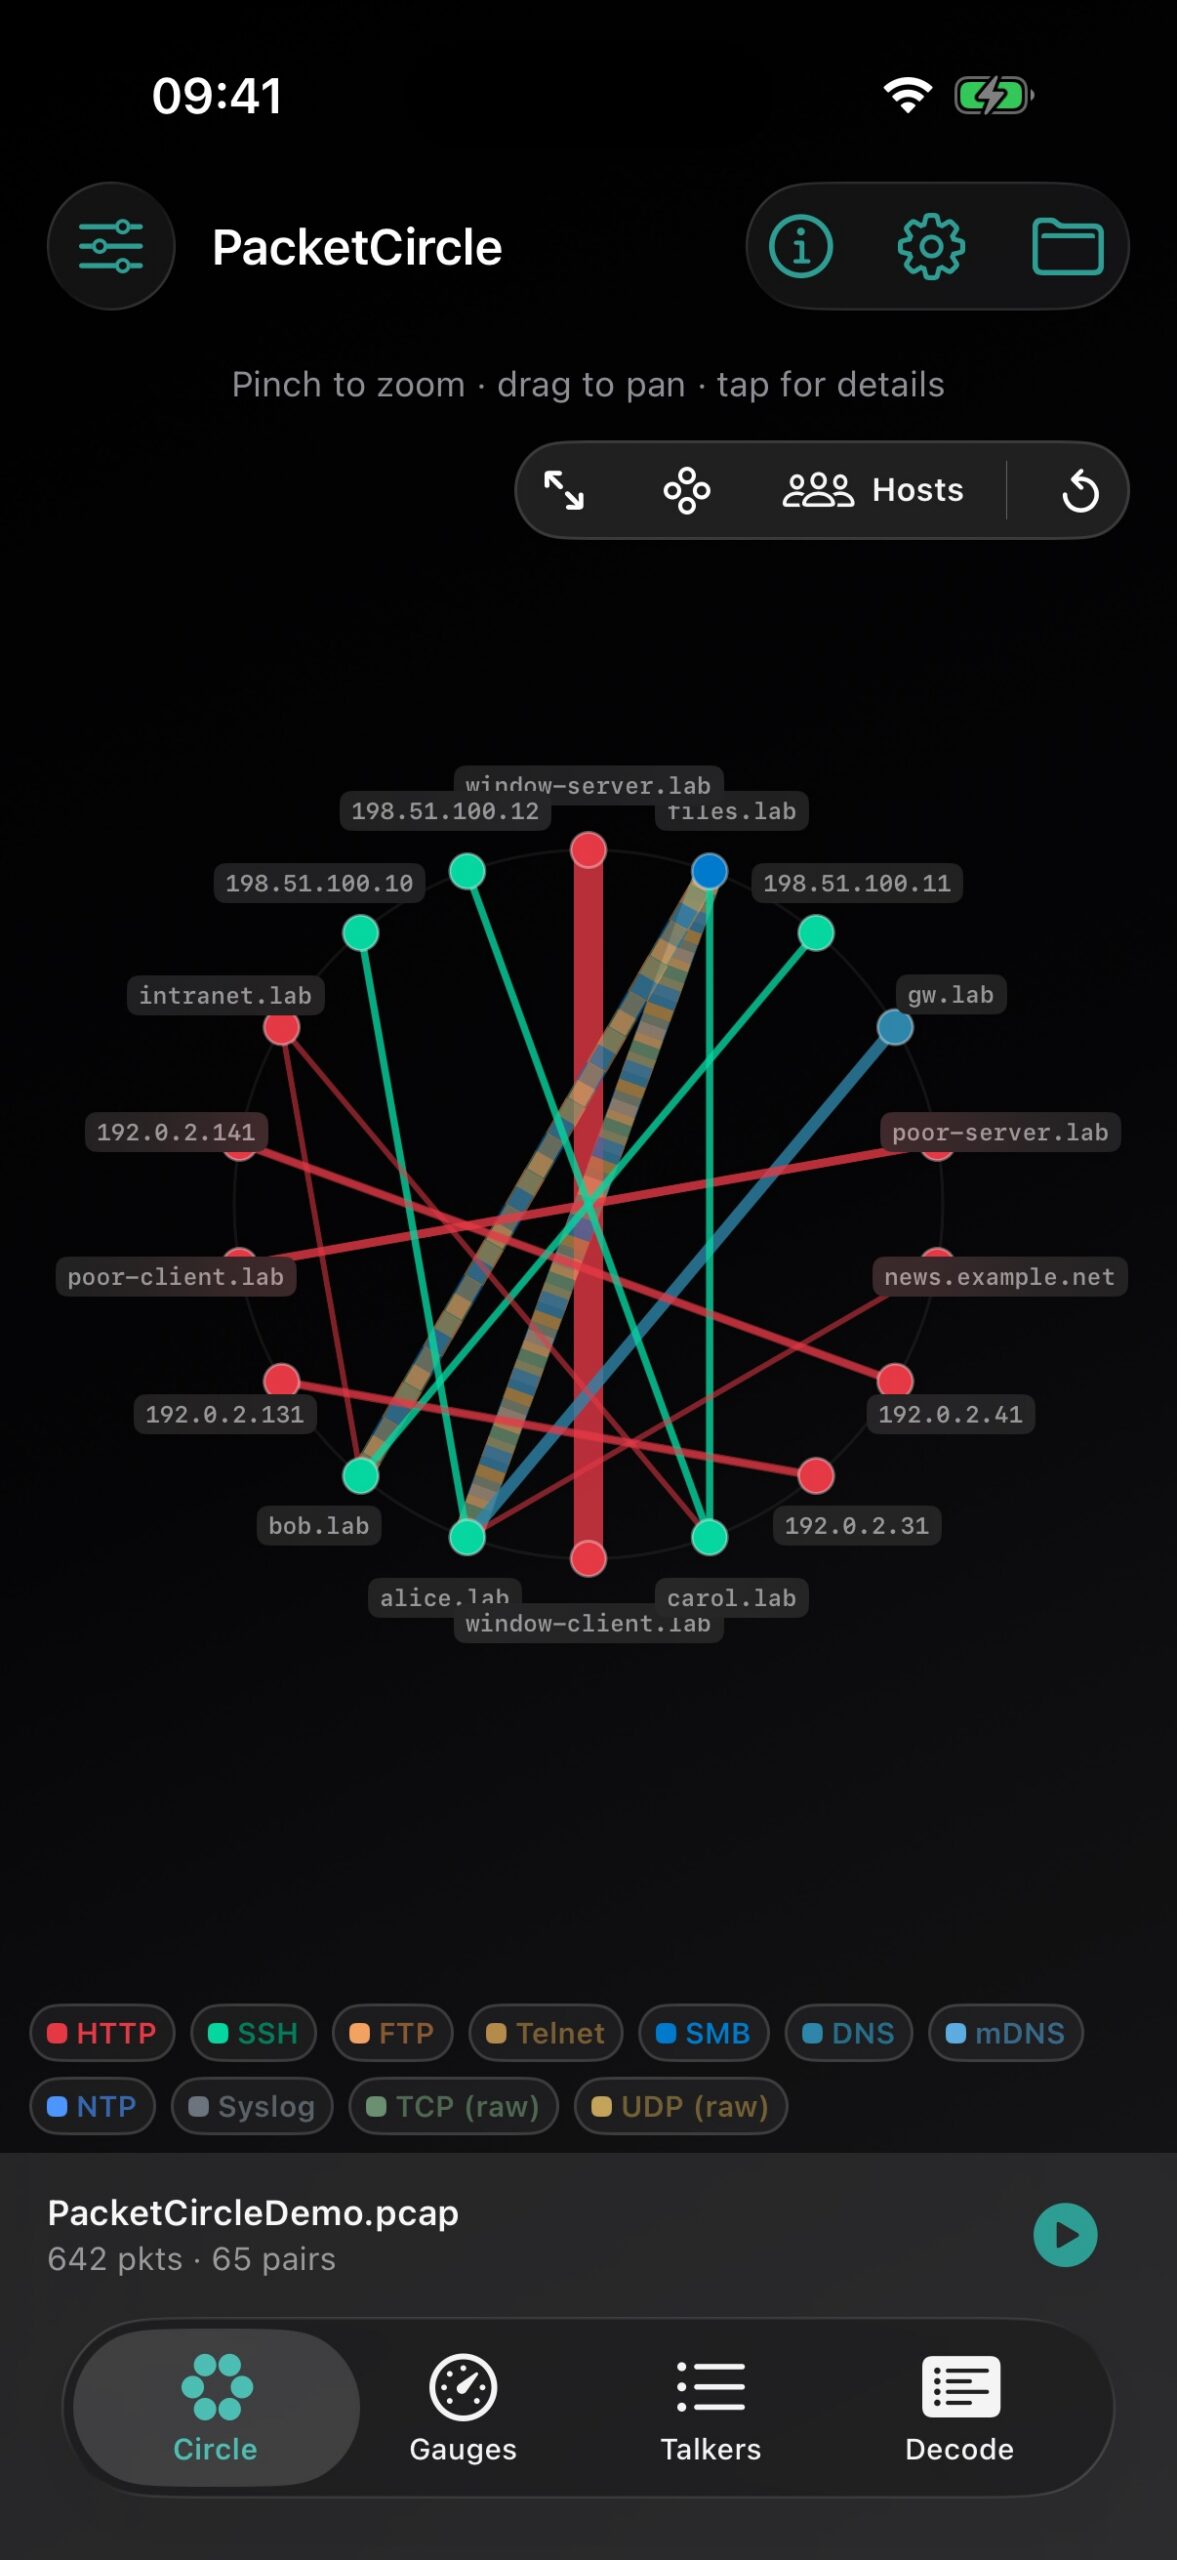
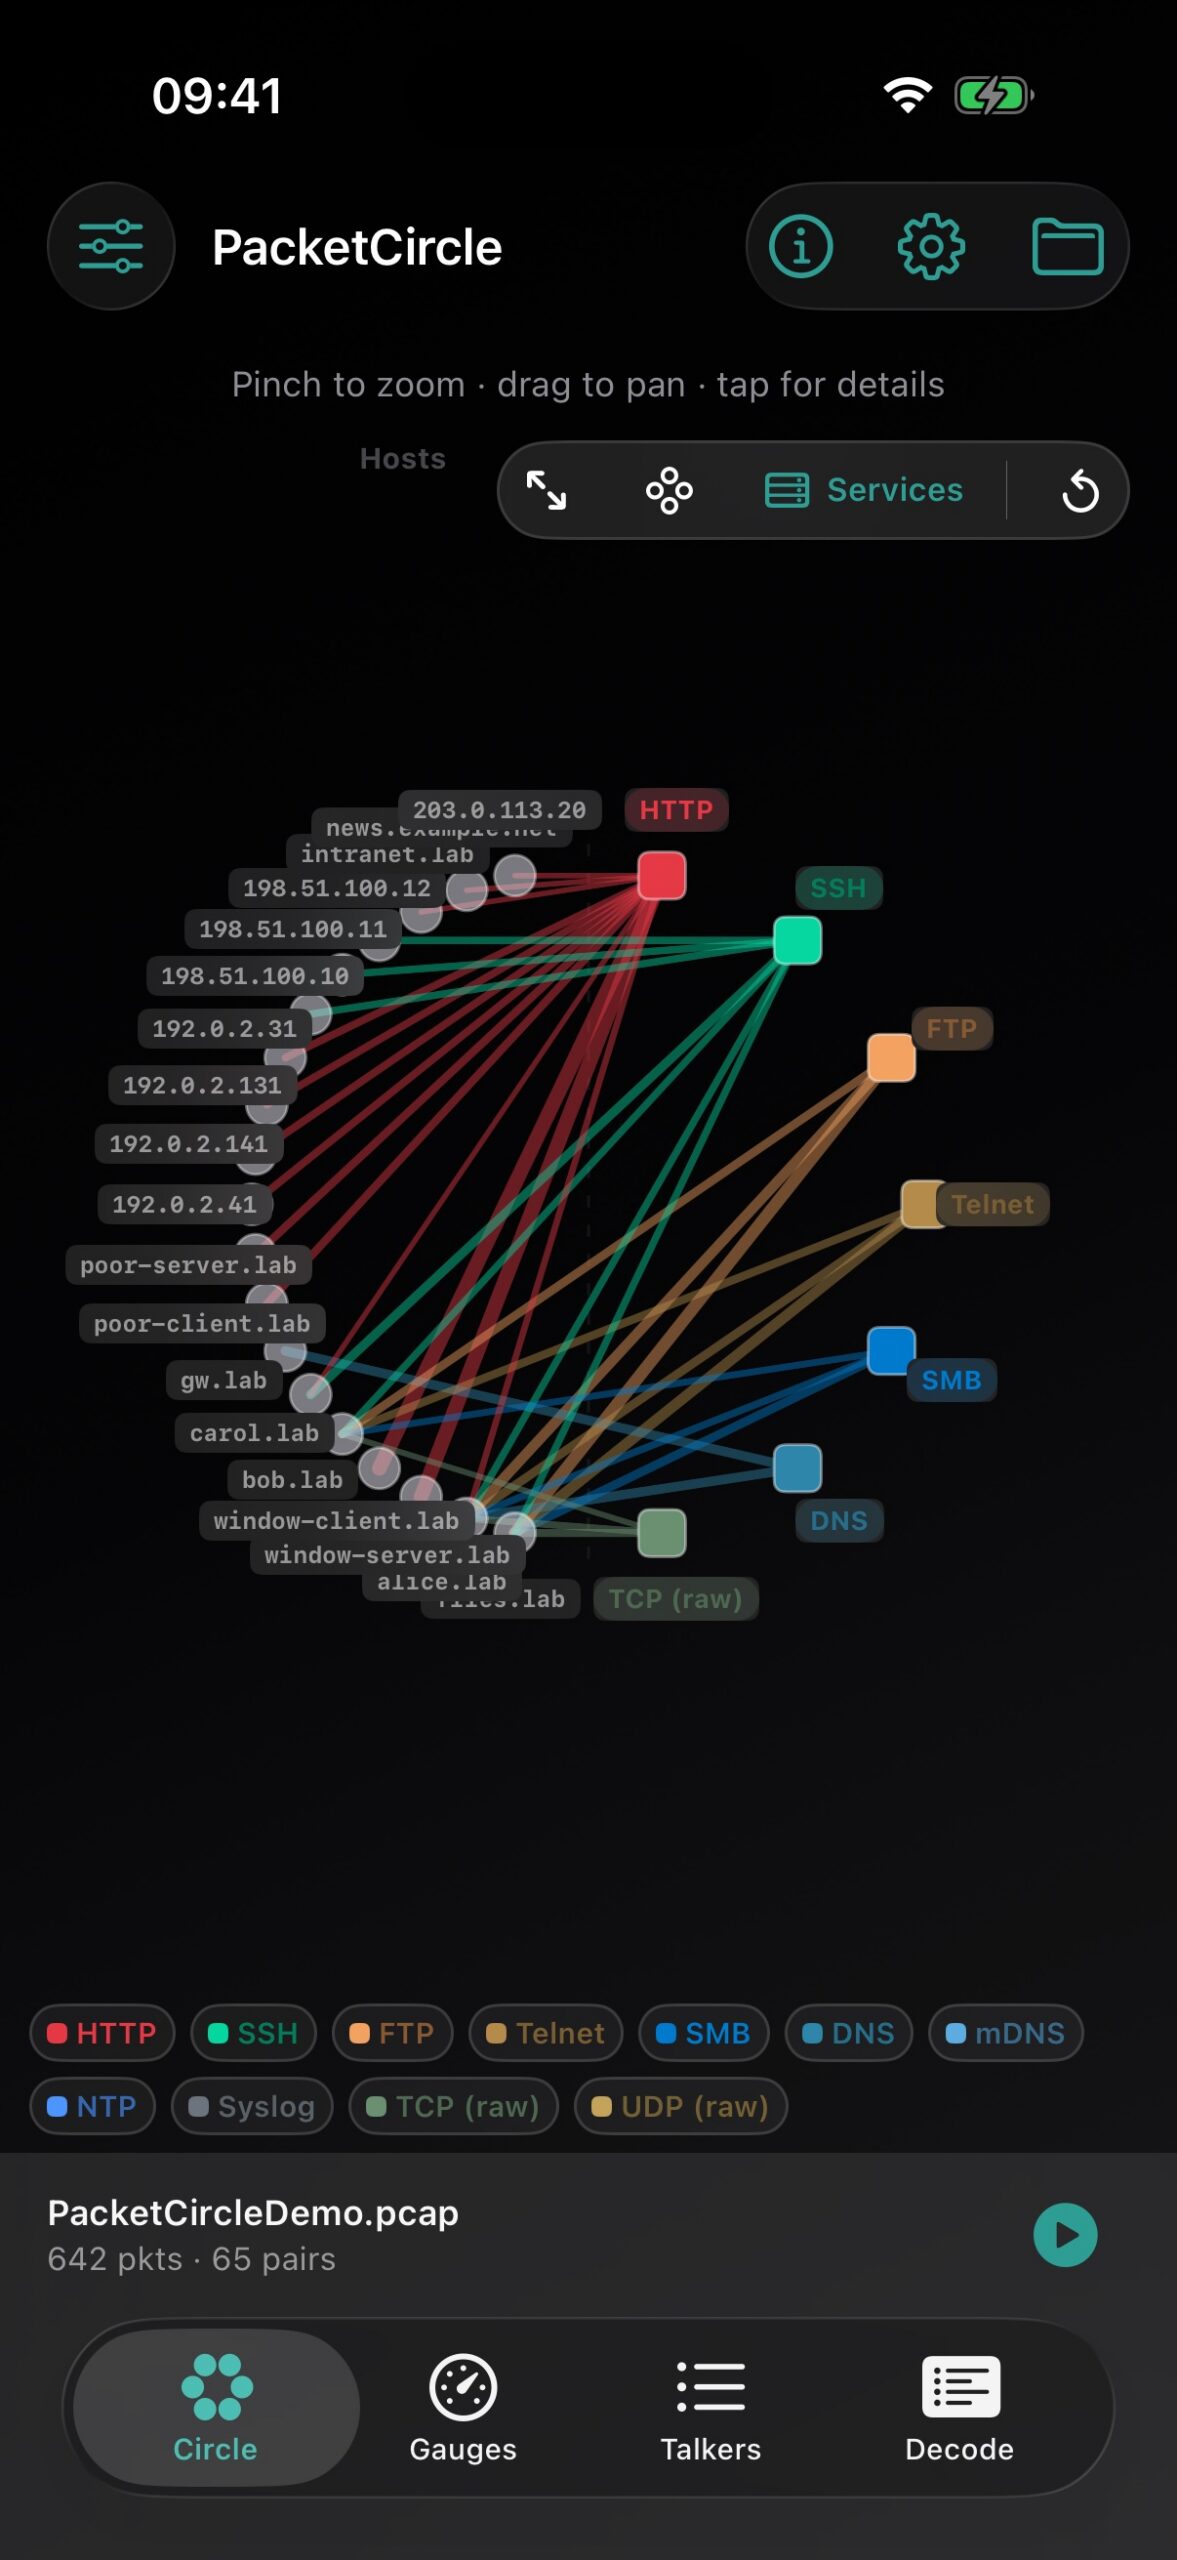
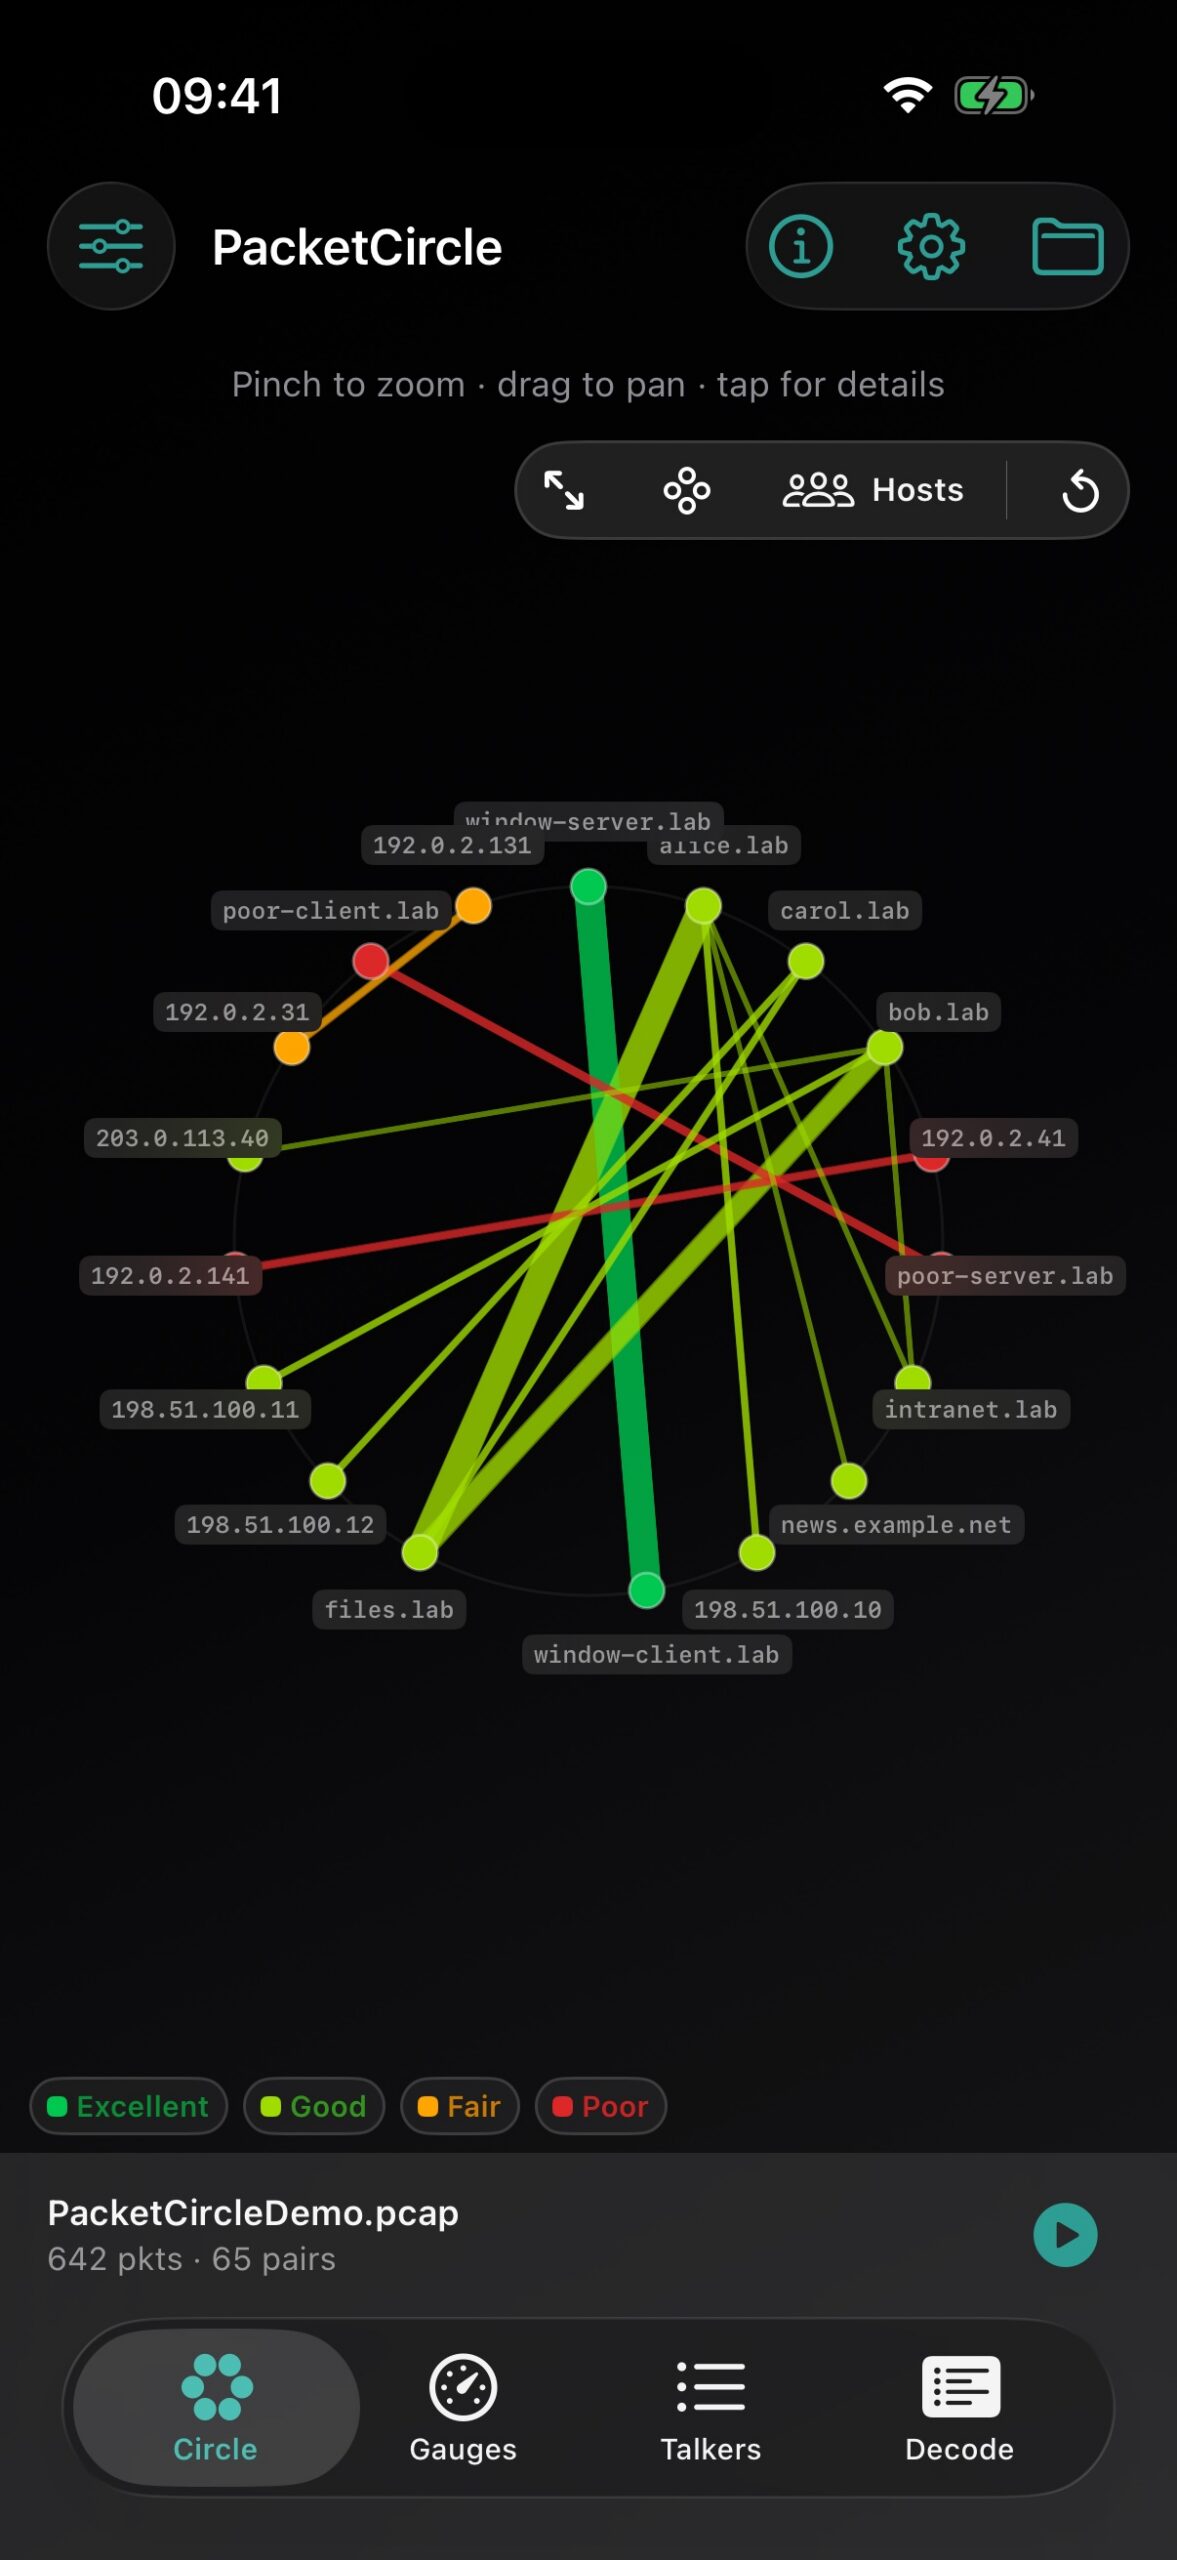
Circle, Services, and Quality views — same capture, three ways to read it.
What it actually does today
Load a capture, and PacketCircle turns it into a circle of talkers you can poke at with your thumb: tap a node or an edge, filter by the legend chips, then drill into session health, skim a decode tree, or follow a TCP stream — all on the phone.
Two switches on the circle change what you’re looking for:
- Color → Protocol paints edges by application (HTTP, SSH, DNS…). Good for “who talks which language.”
- Color → Quality paints the same host nodes by native TCP session health — Excellent / Good / Fair / Poor. Sick conversations light up red without opening Wireshark. The legend chips become grade filters, so you can solo Poor and hide the noise.
- Hosts vs Services rearranges the ring: hosts around the rim (node-to-node), or hosts on one side and service ports on the other (who speaks HTTP/SSH/…).
Gauges add a Degraded Quality Conversations list (Fair/Poor) and a quality timeline you can tap into a time slice for Talkers. Conversation summaries are bi-directional; ports show when you pick a socket. Optional Show host names pulls shortened labels from DNS / mDNS / NetBIOS in the capture.
No file handy? There’s a built-in demo capture that replays so you can see the whole thing move without a lab network.
The 2-minute tour
- Open a capture or hit Demo Mode.
- Play in the Circle: tap nodes/edges; flip Color between Protocol and Quality; use the legend chips as filter. Hosts vs Services rearranges the ring.
- Peek at Gauges for rates, degraded Fair/Poor conversations, and the quality timeline.
- Browse Talkers for the full conversation list, or Decode for frames + details/hex.
- Open Session details for the bi-dir summary, TCP health, exchange ladder, and app decode.
- Follow TCP Stream when you want the reassembled payload (ASCII/hex) — with a budget so your phone doesn’t melt on a 2 GB elephant.
- Tap the status bar (filename · packets · pairs) to replay with original timing.
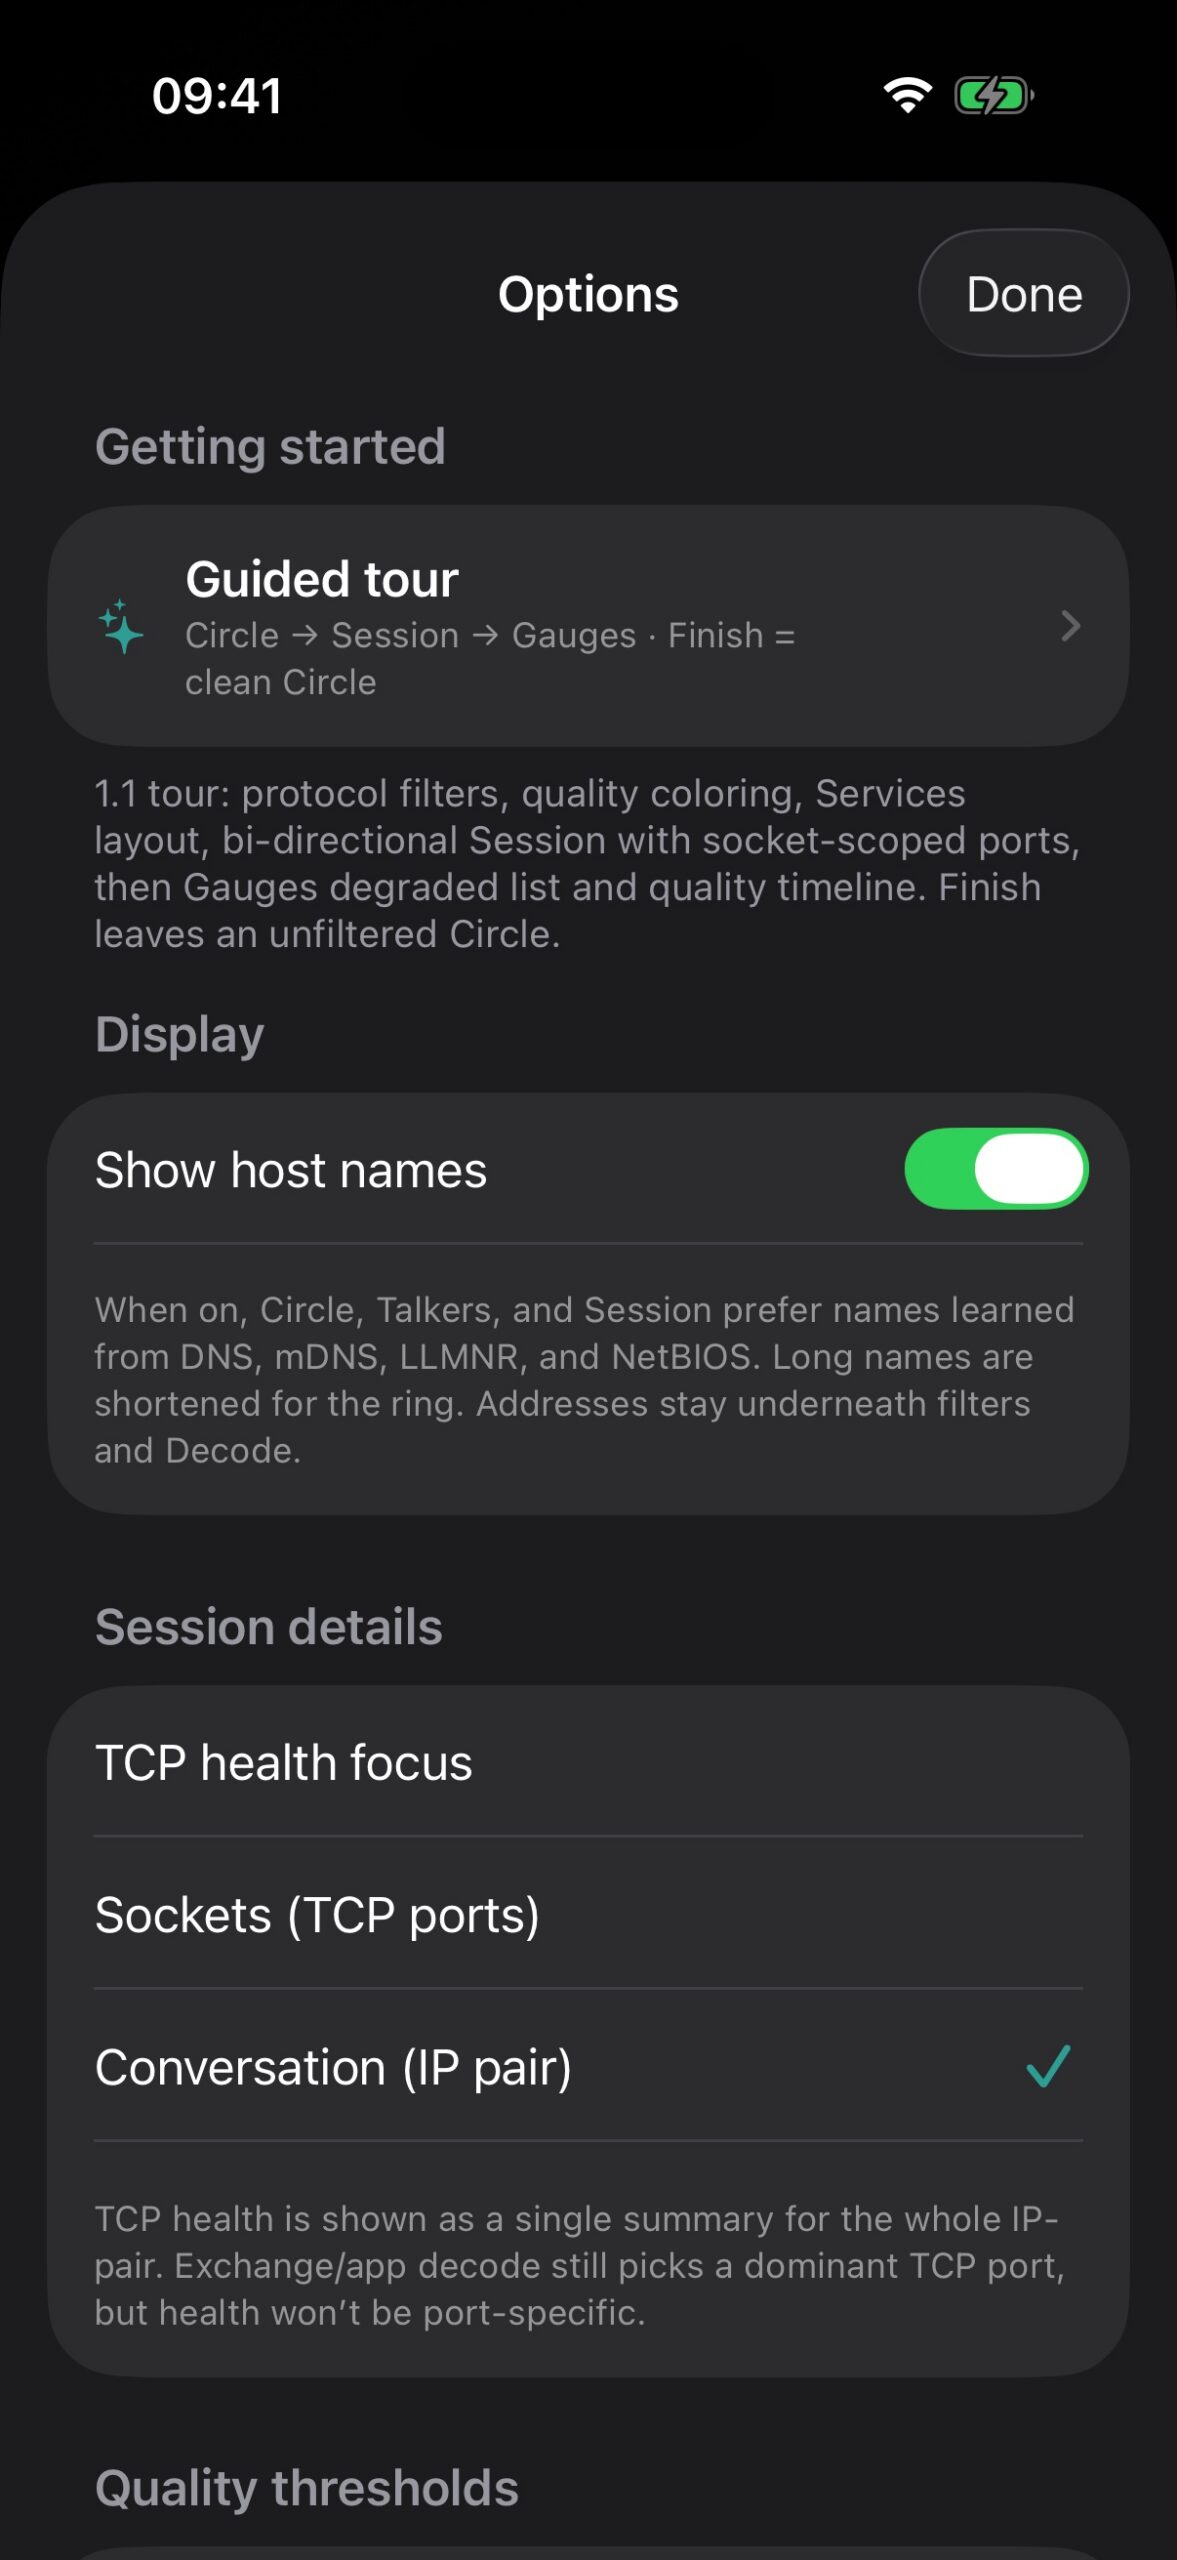
- Open the ⓘ About and the Options gear for the guided tour, quality bands, host names, IP-pair vs TCP-socket focus, and the stream budget.
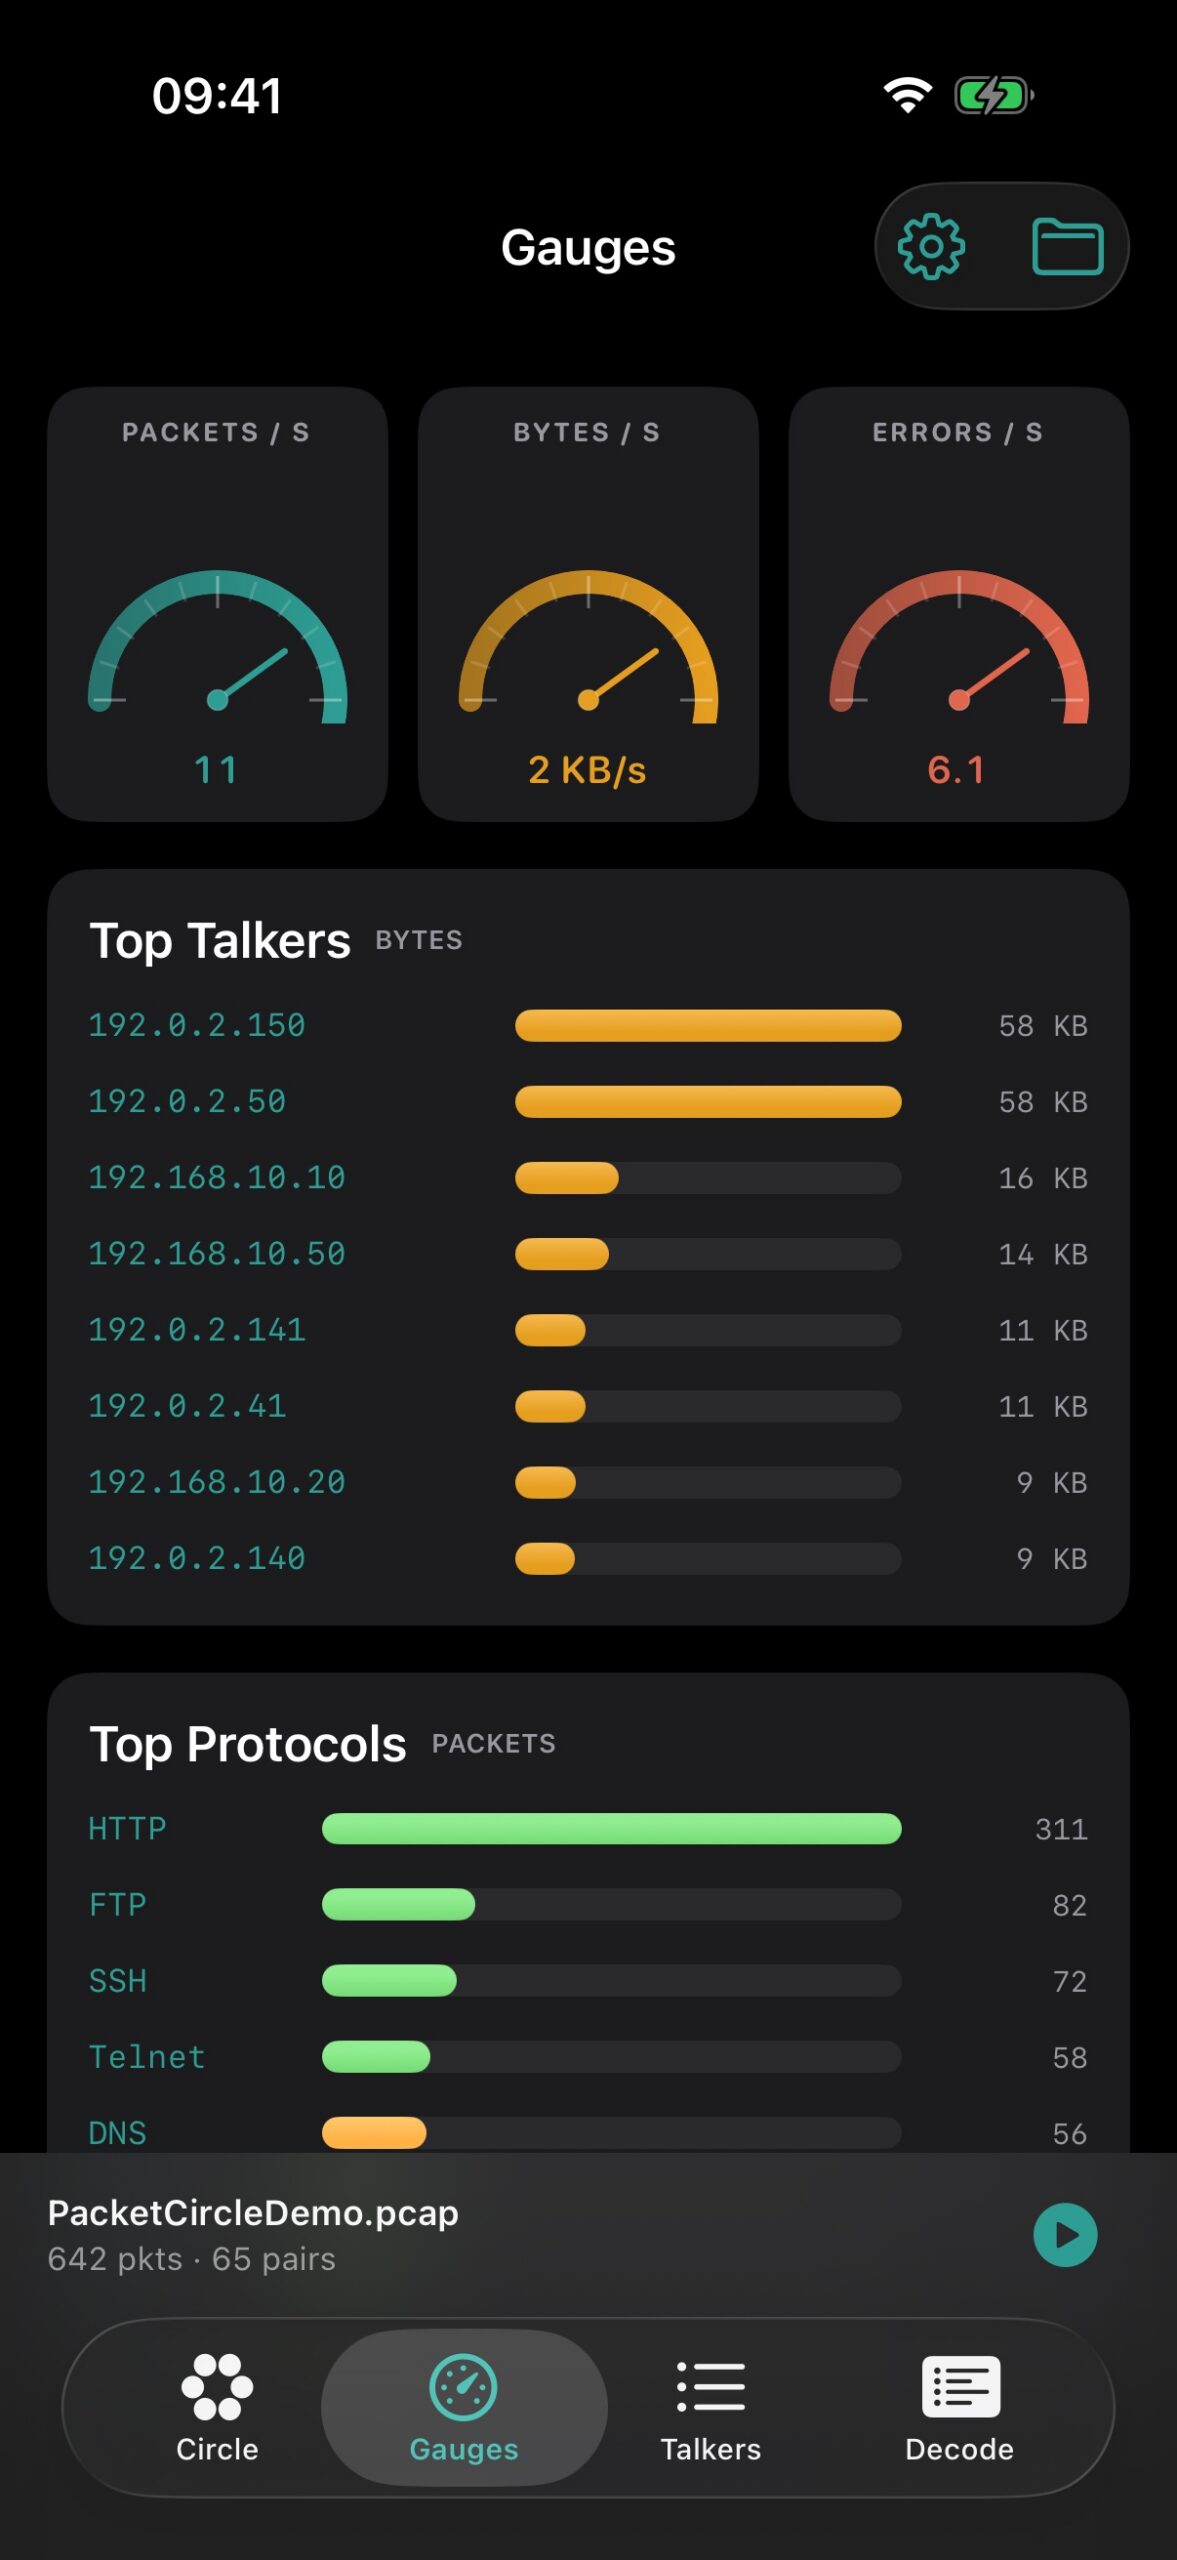
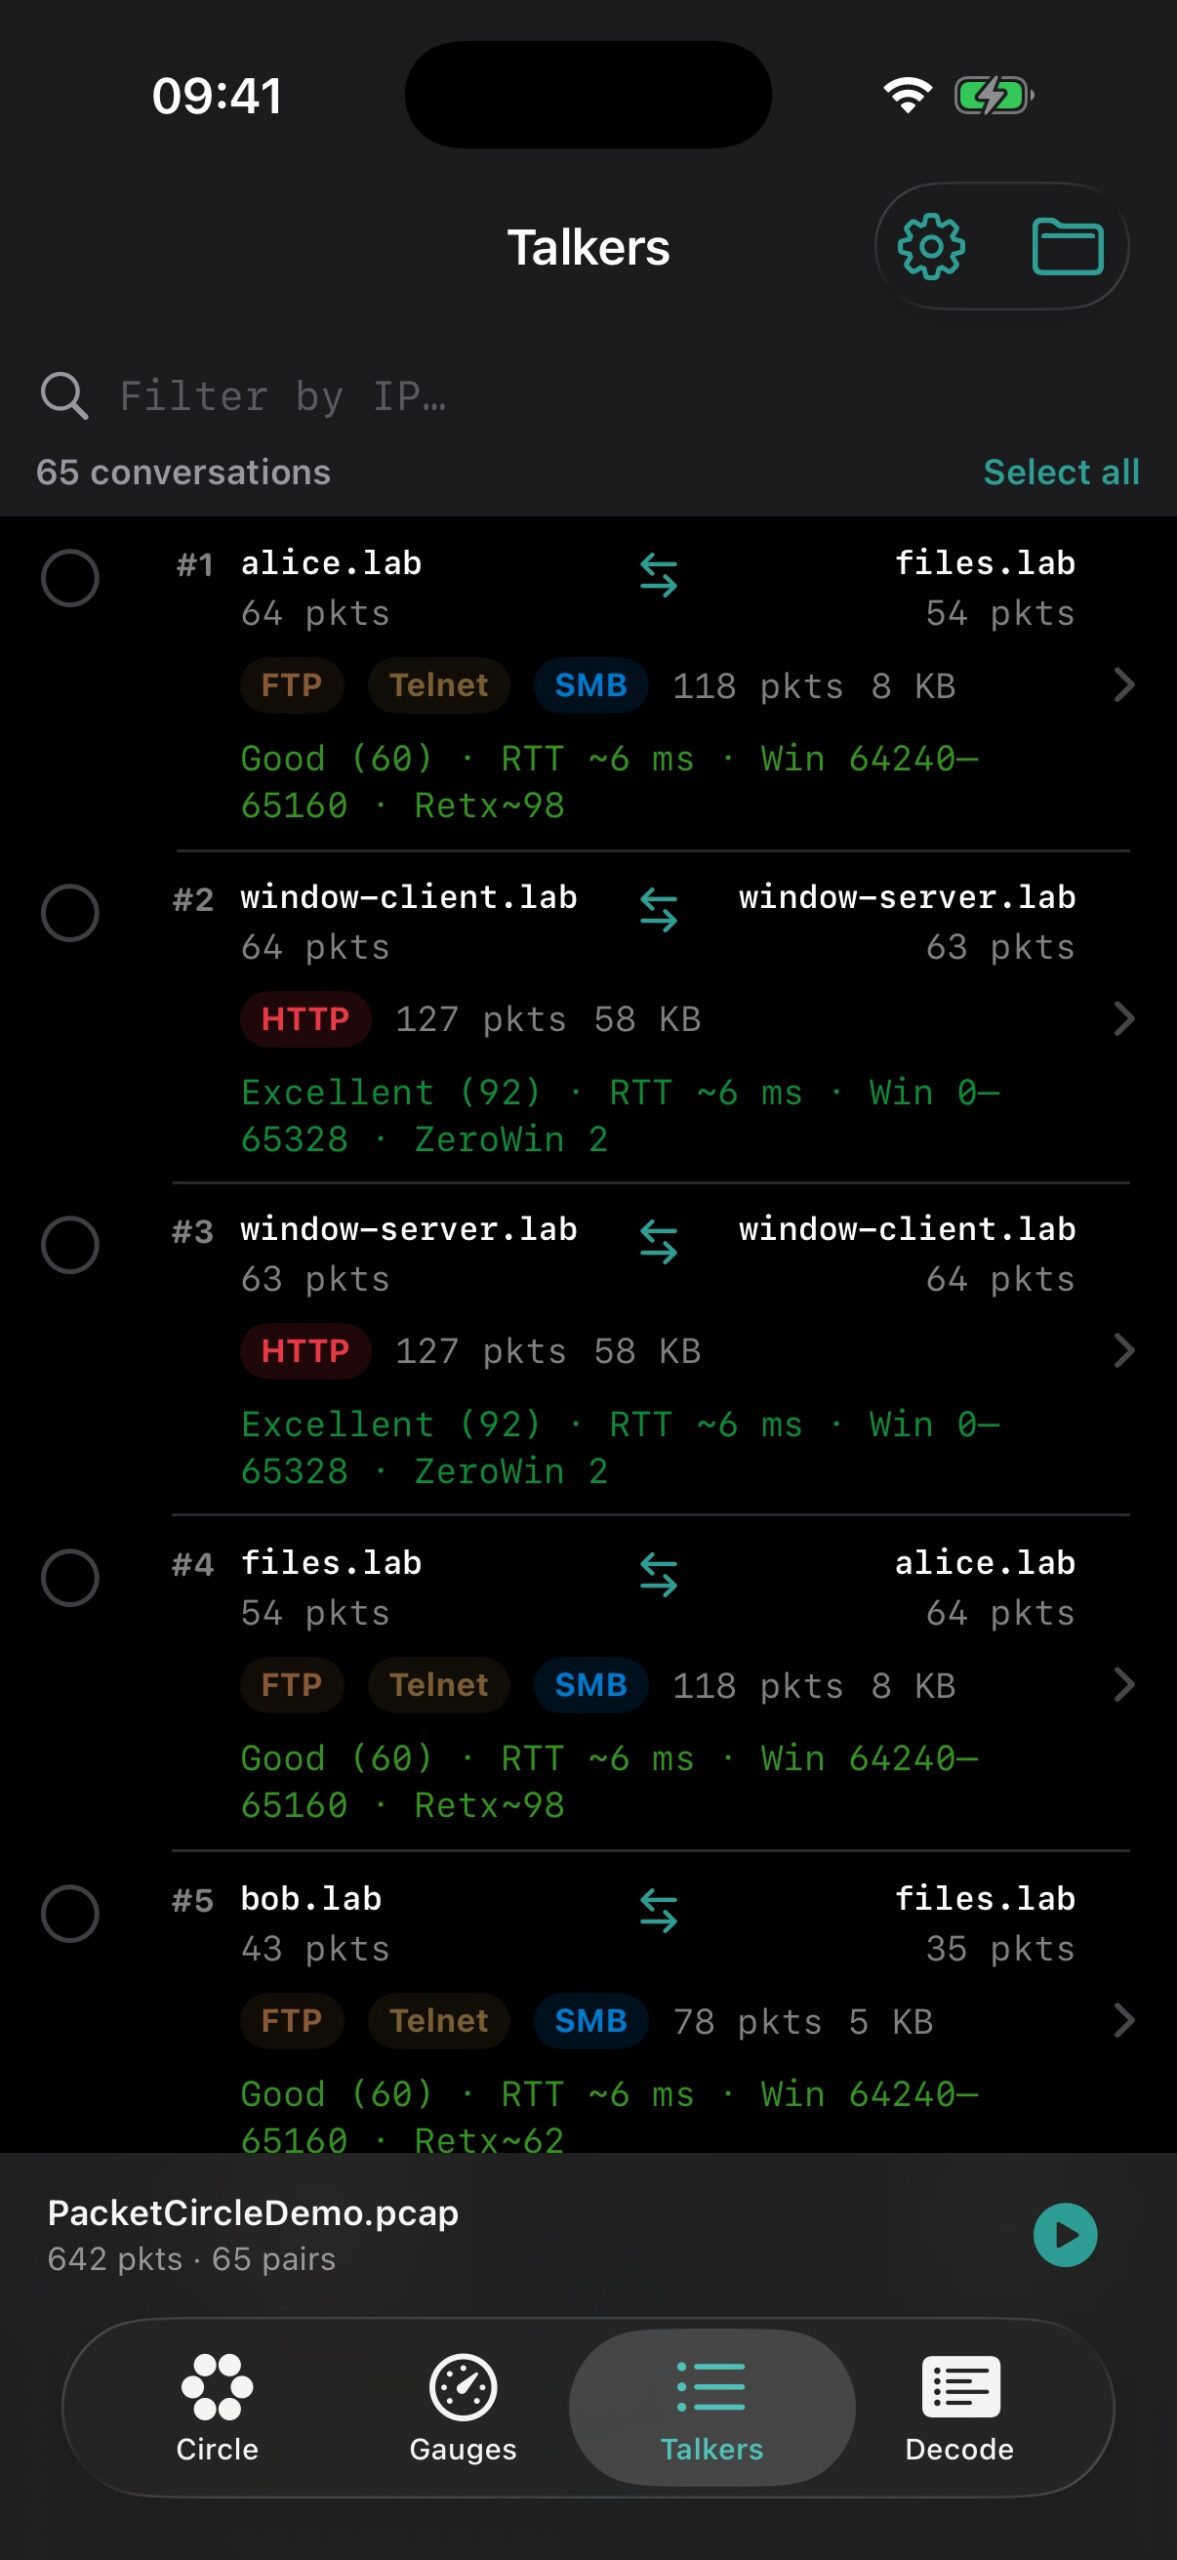
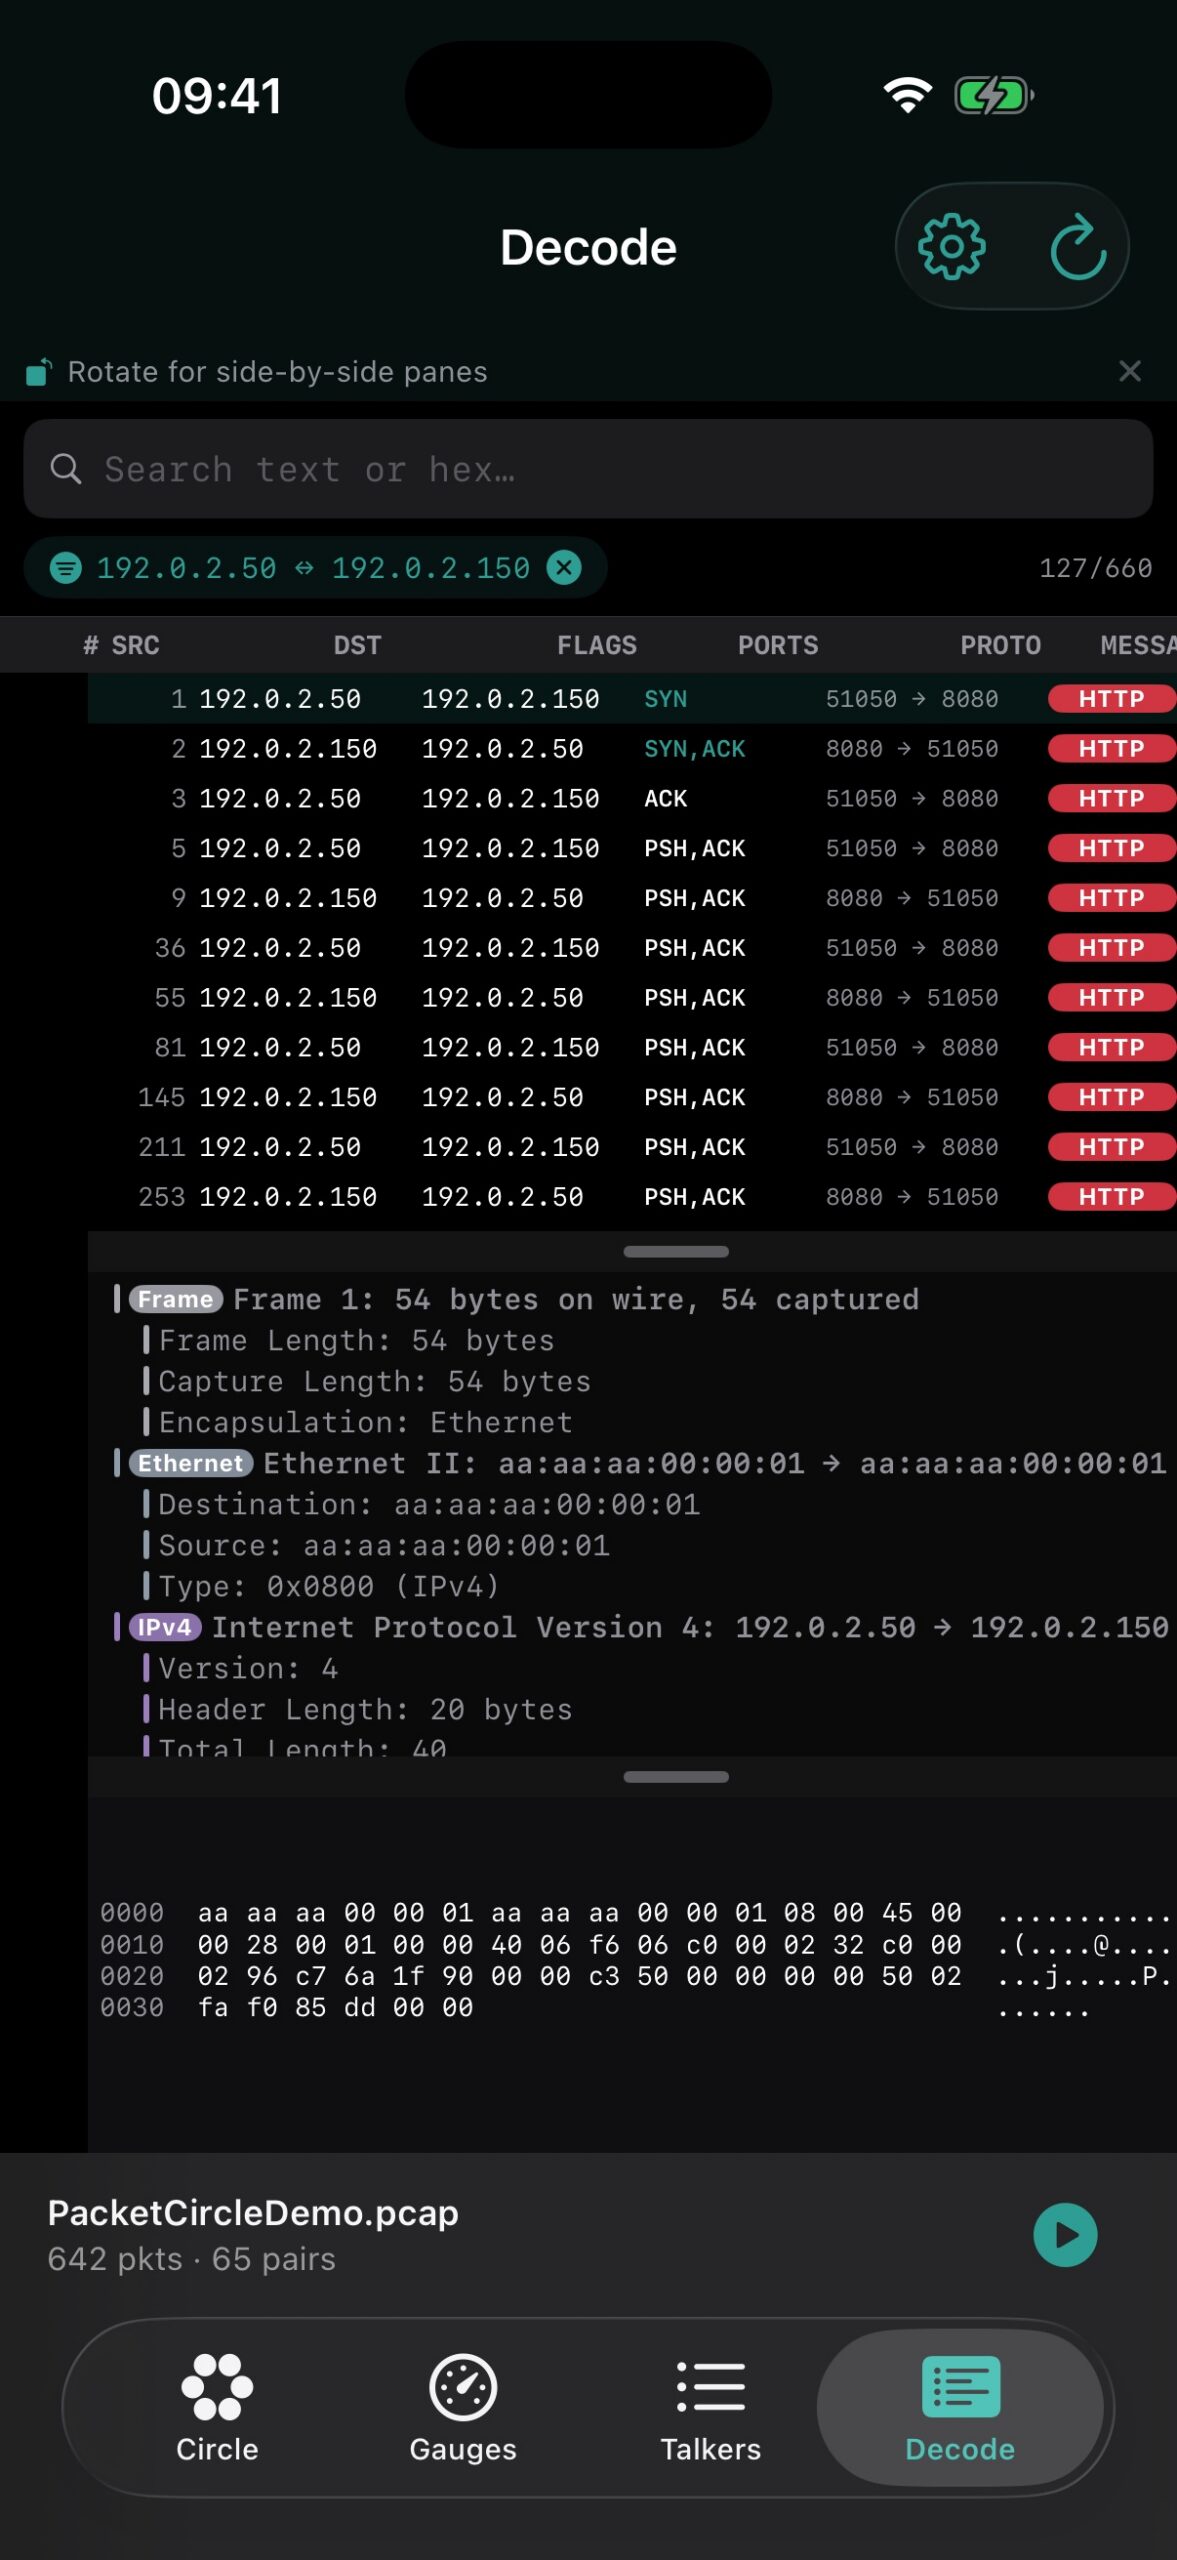
Gauges, Talkers, and Decode.
Feature list (v1.2.5)
| Area | What you get |
|---|---|
| Open | PCAP / PCAPNG from Files / share sheet — fully offline |
| Demo | Bundled demo capture, replayable |
| Circle | Conversation graph; Protocol or Quality edge colors; Hosts / Services layout; Top-N focus |
| Quality coloring | Edges graded Excellent / Good / Fair / Poor from native TCP health; legend chips filter by grade |
| Gauges | Rates, top talkers & protocols; Degraded Quality Conversations; quality timeline → Talkers slice |
| Talkers | All analyzed pairs (Circle keeps Top-N); bi-dir summary; protocol badges and health grades |
| Decode | Packet list, friendly details tree, hex/ASCII (capped frames); broader infra peeks in 1.1 |
| Session health | Native TCP score & metrics — RTT, window, retransmits, RST, zero-window, SYN/FIN (not Wireshark tcp.analysis) |
| Conversation UI | Bi-directional hosts; ports when a socket is selected; unnamed listeners stay visible |
| Host names | Optional shortened DNS / mDNS / LLMNR / NetBIOS labels (Options) |
| Quality charts | TCP line graphs over the session: ACK round trip, packet size, inter-arrival (and related series) |
| TCP exchange | Client↔server ladder of segments/ACKs |
| Application decode | Lightweight previews (DNS/HTTP/Telnet/… + infra where present) |
| Follow TCP Stream | Reassembly, direction filters, ASCII/hex (budget-capped) |
| Replay | Tap the status bar → replay with original timing |
| Options | Quality thresholds, host names, IP-pair vs TCP-socket focus, stream budget |
| Guided tour | Circle → Session → Gauges; Finish leaves a clean desk |
| Remote capture | PCAP over IP (1.2.5+) — pull a live stream from a sensor you point it at (pcapoverip, PolarProxy); the phone never sniffs its own Wi-Fi or cellular traffic |
| Sanitize | On-device payload sanitize (1.2.5+) — the PacketSanitizerPro modes, native on iPhone/iPad |
| Report | Native PDF report generation (1.2.5+) — the PacketReporterPro report set, same pipeline as the Mac app |
| Privacy | Analysis stays on device — no upload, no telemetry, ever. PCAP over IP is opt-in: you choose the sensor it connects to. |
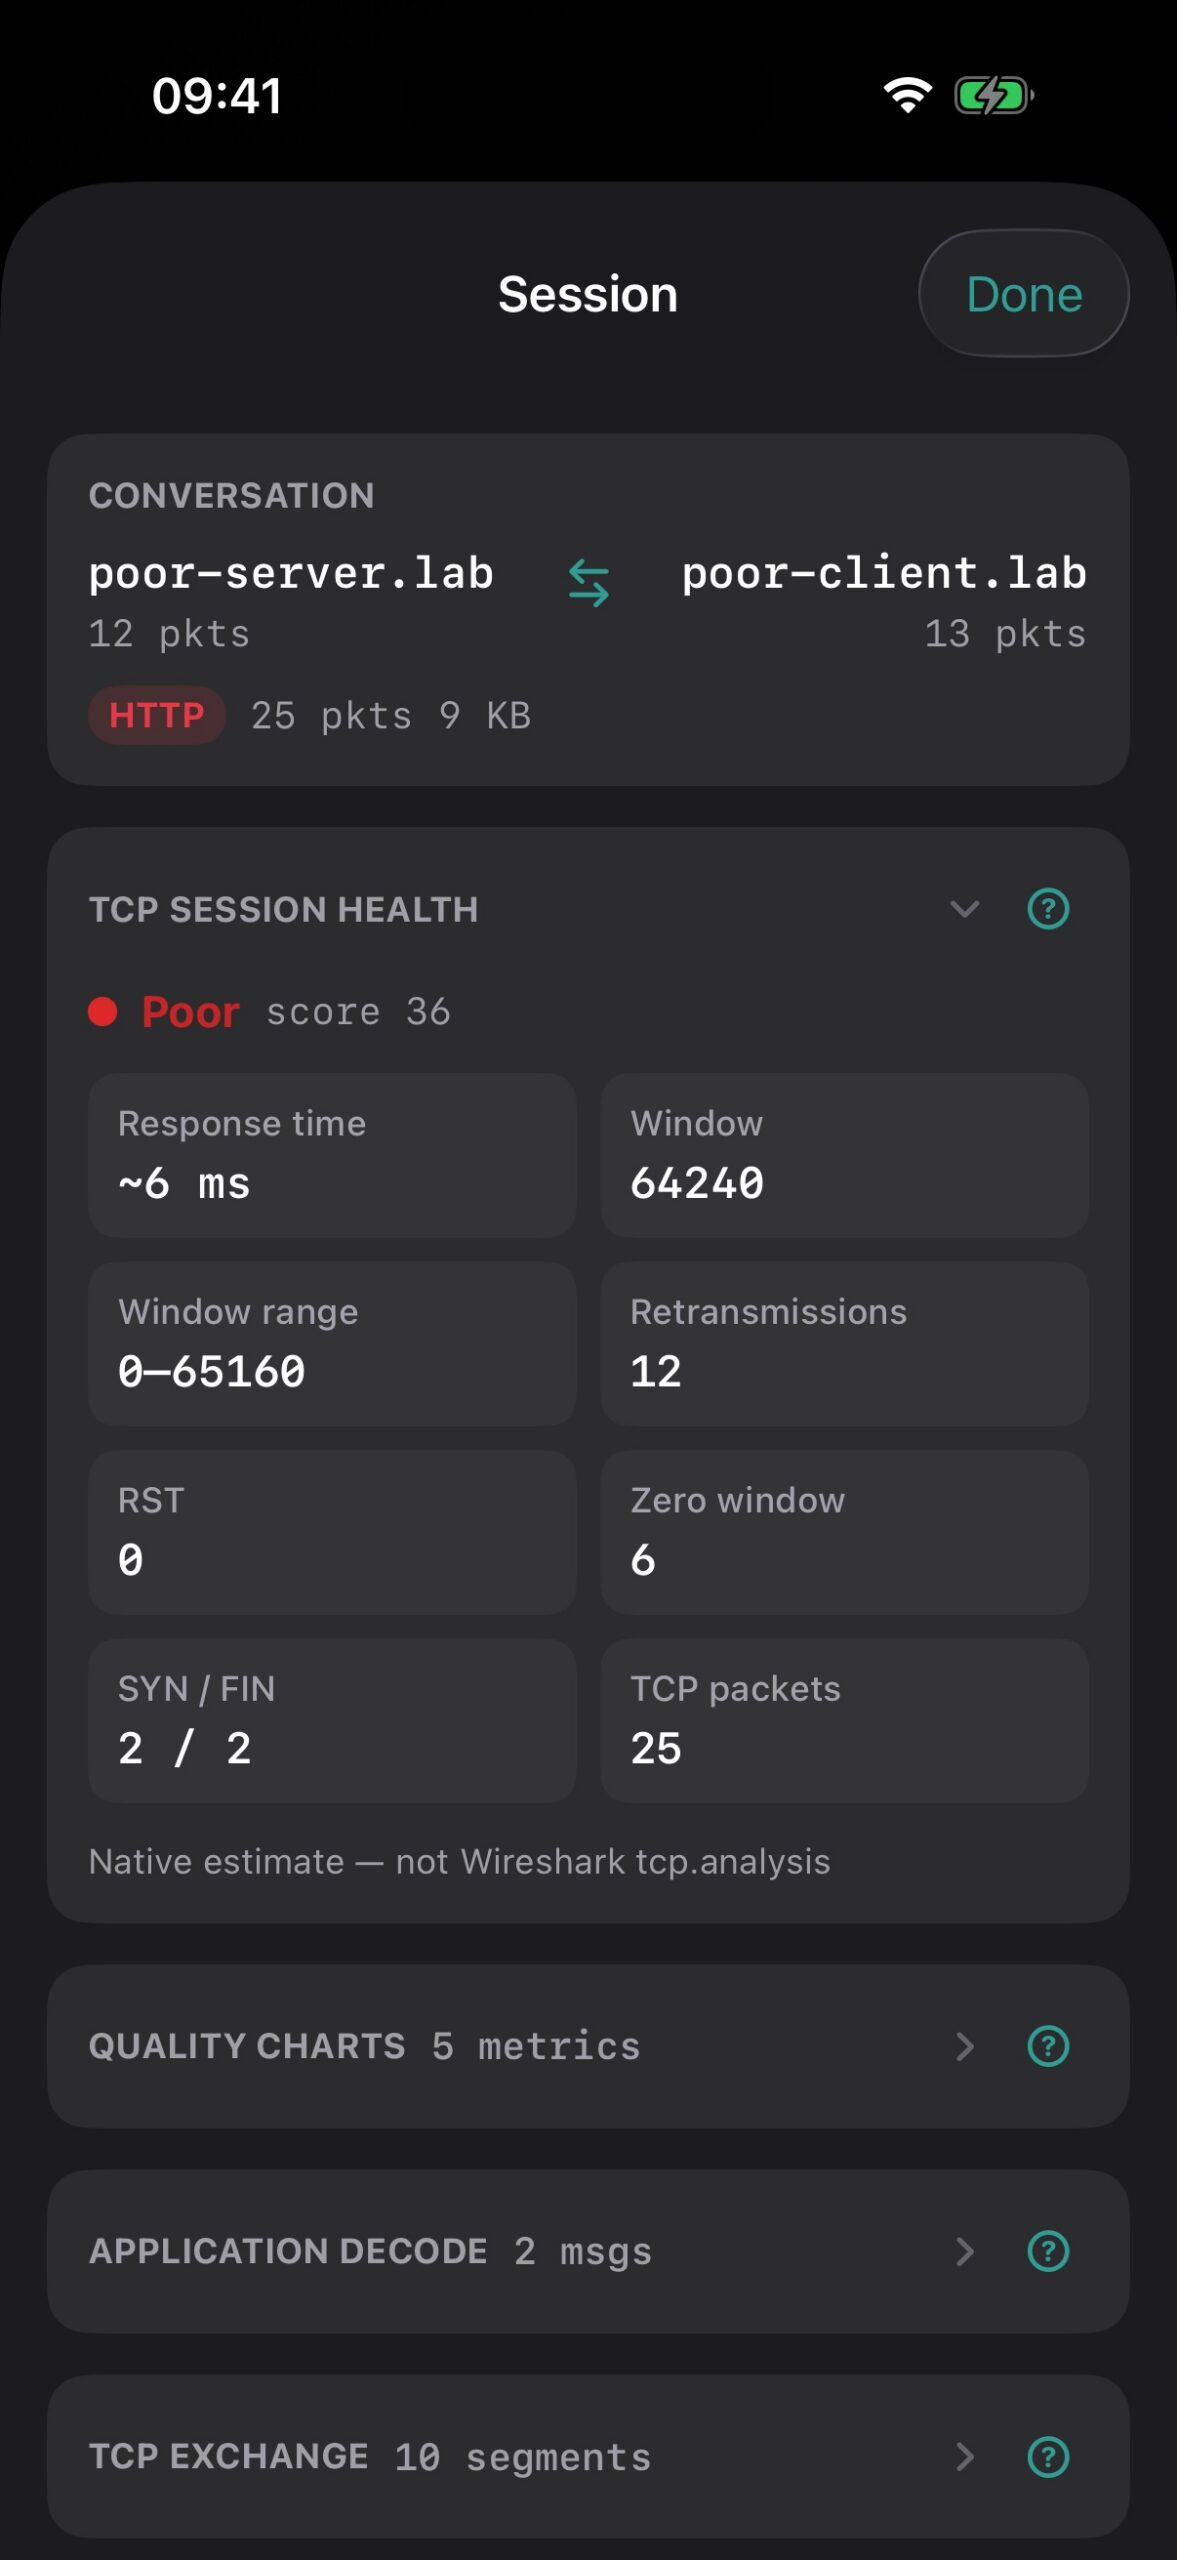
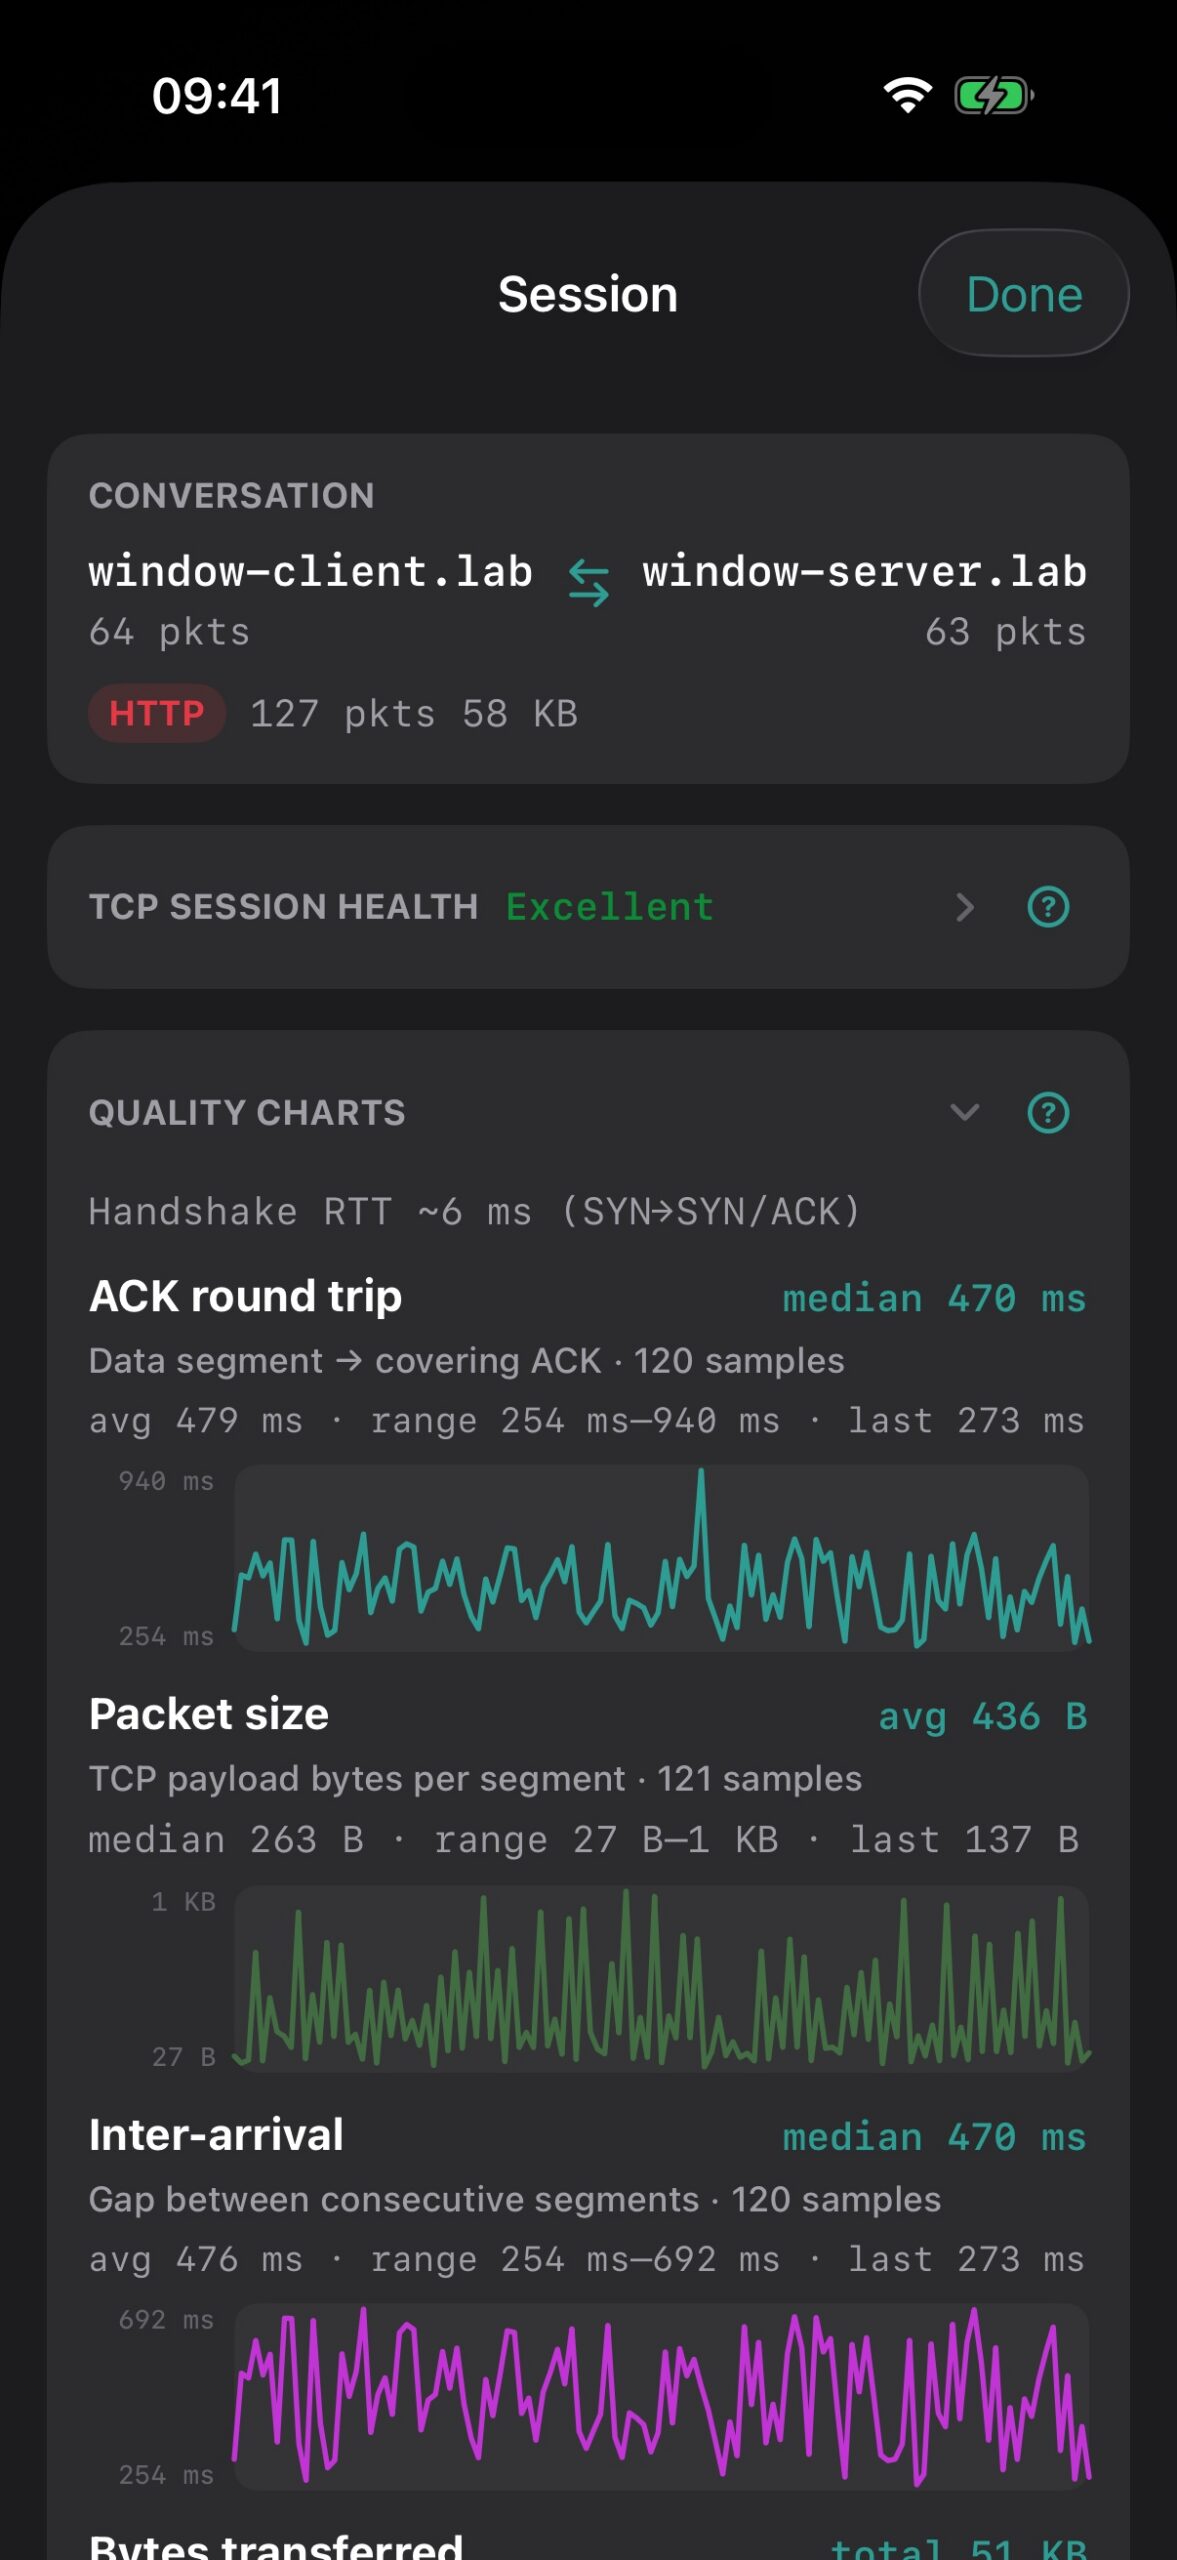
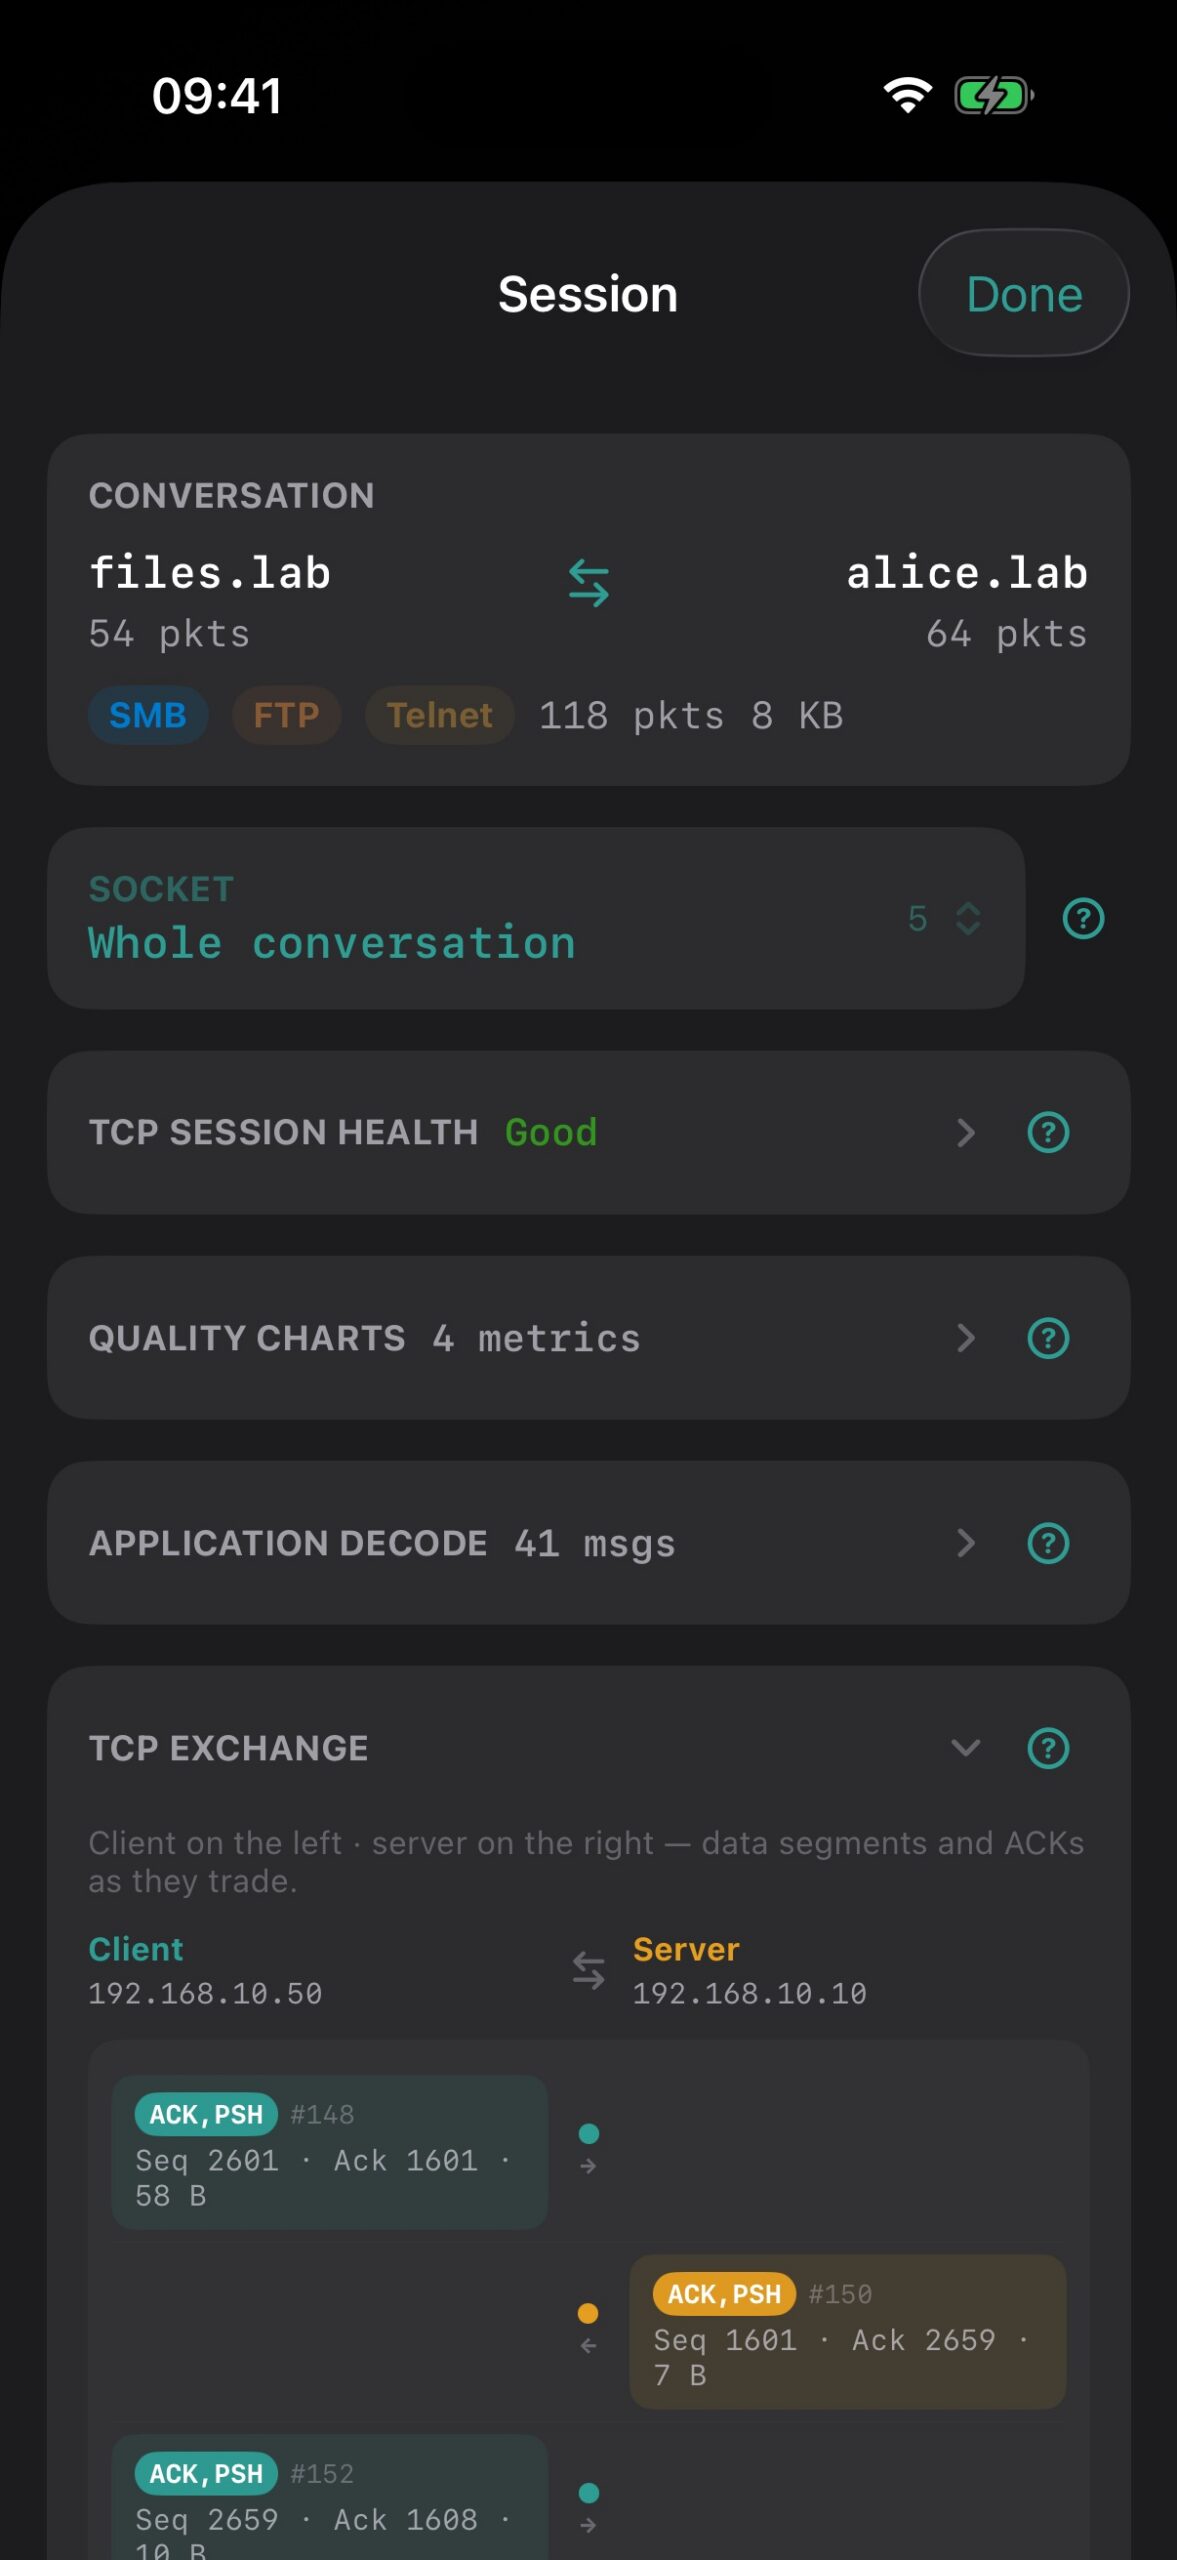
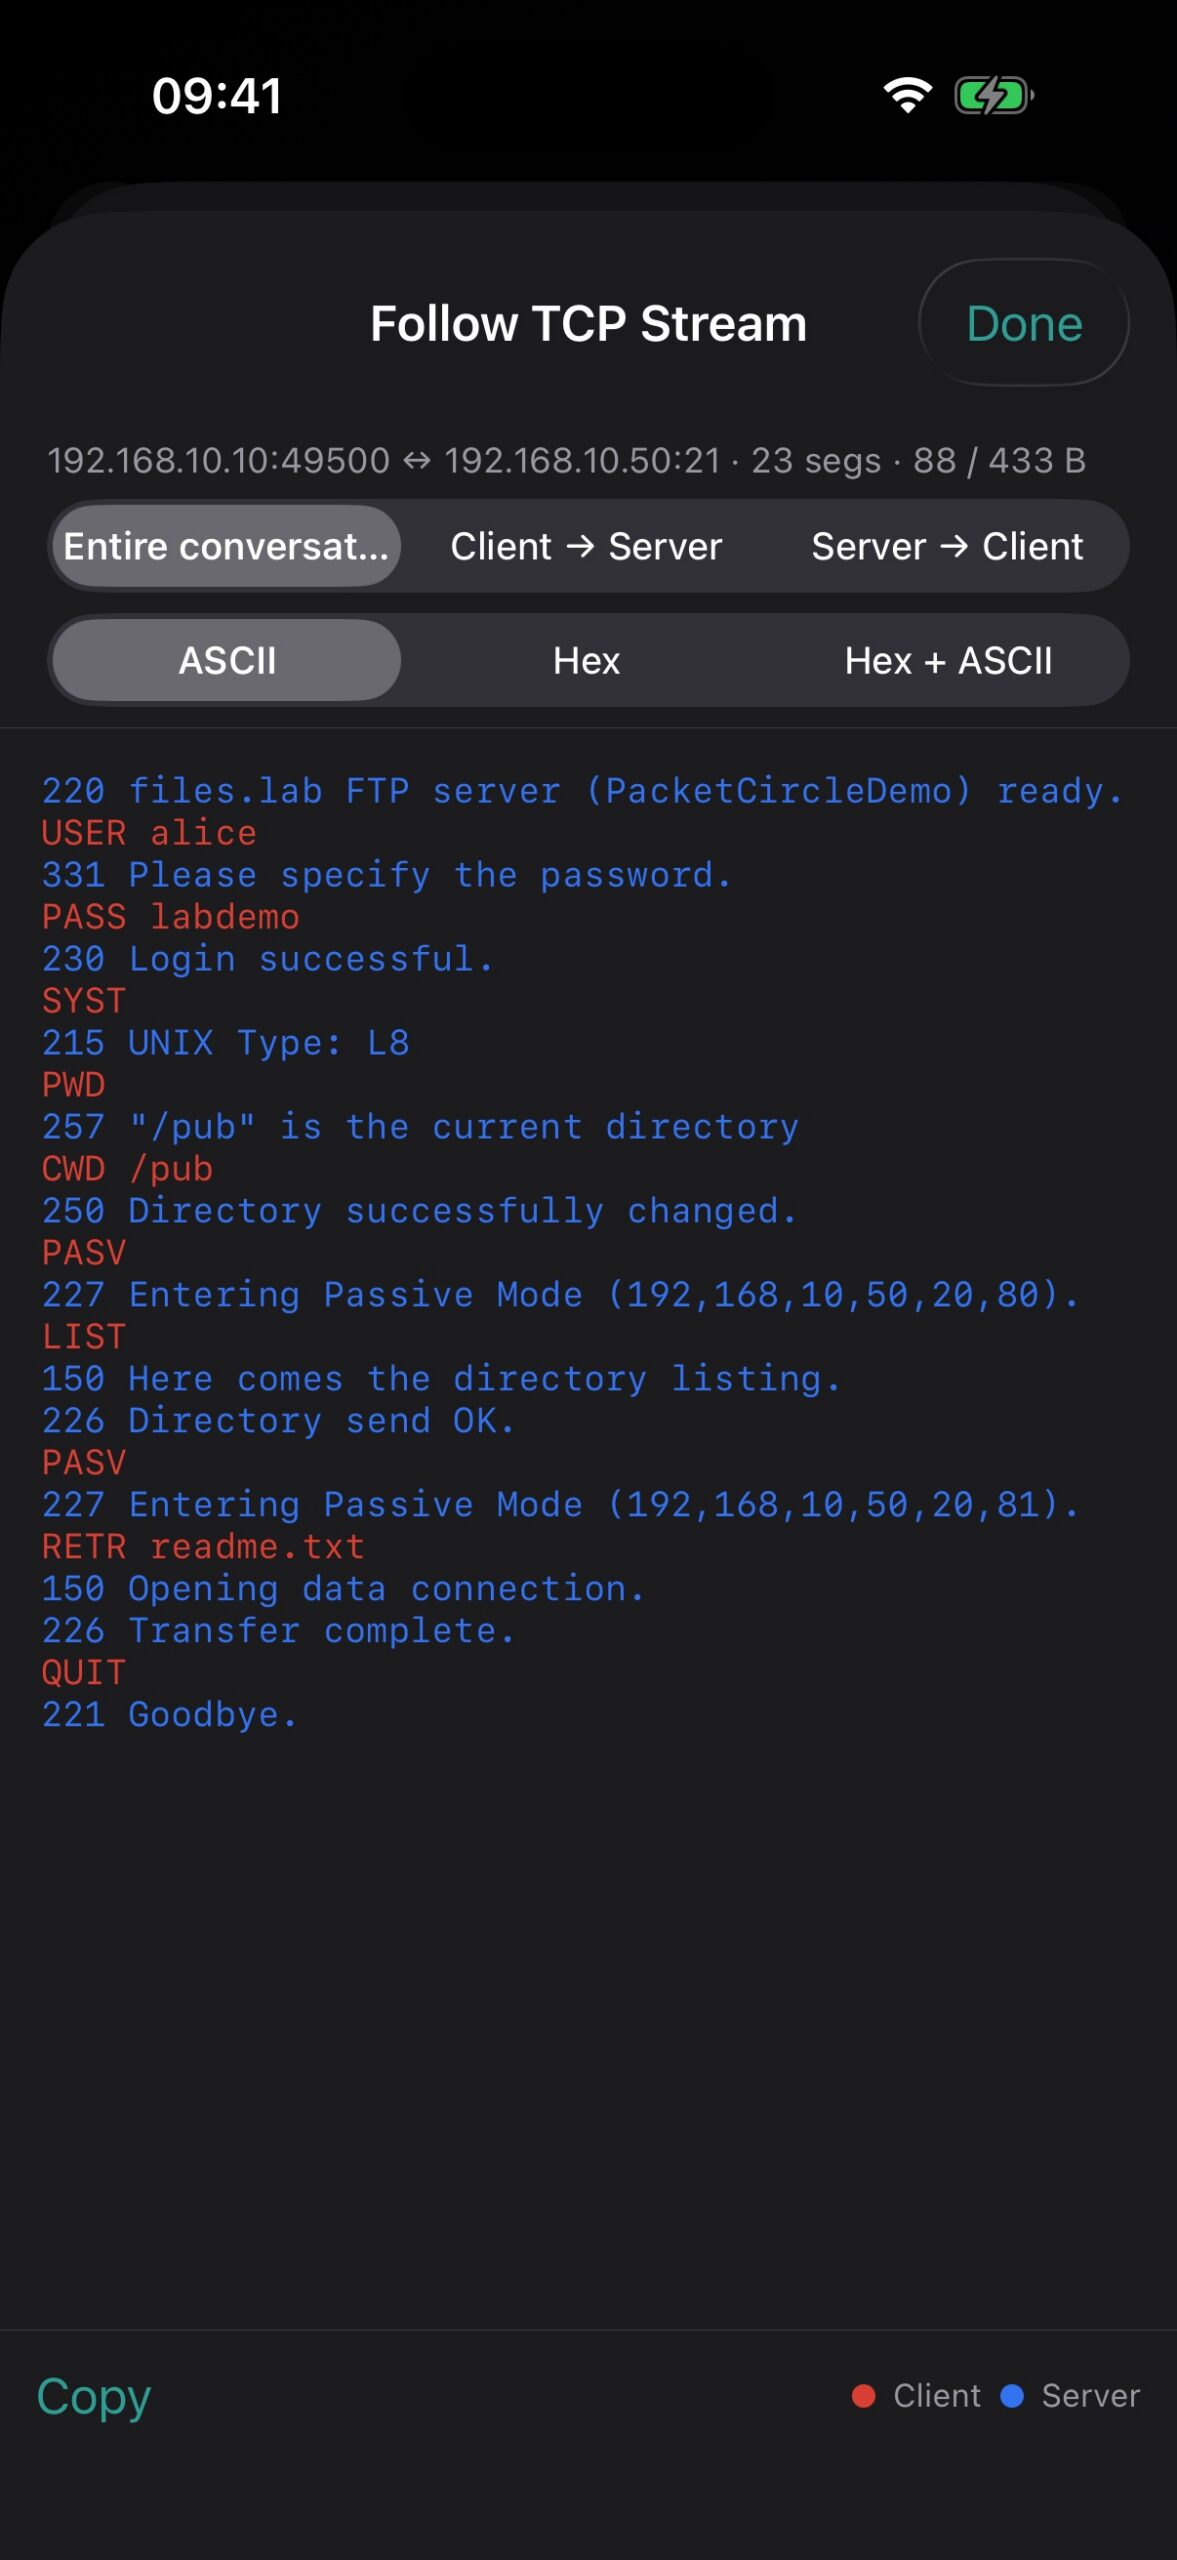
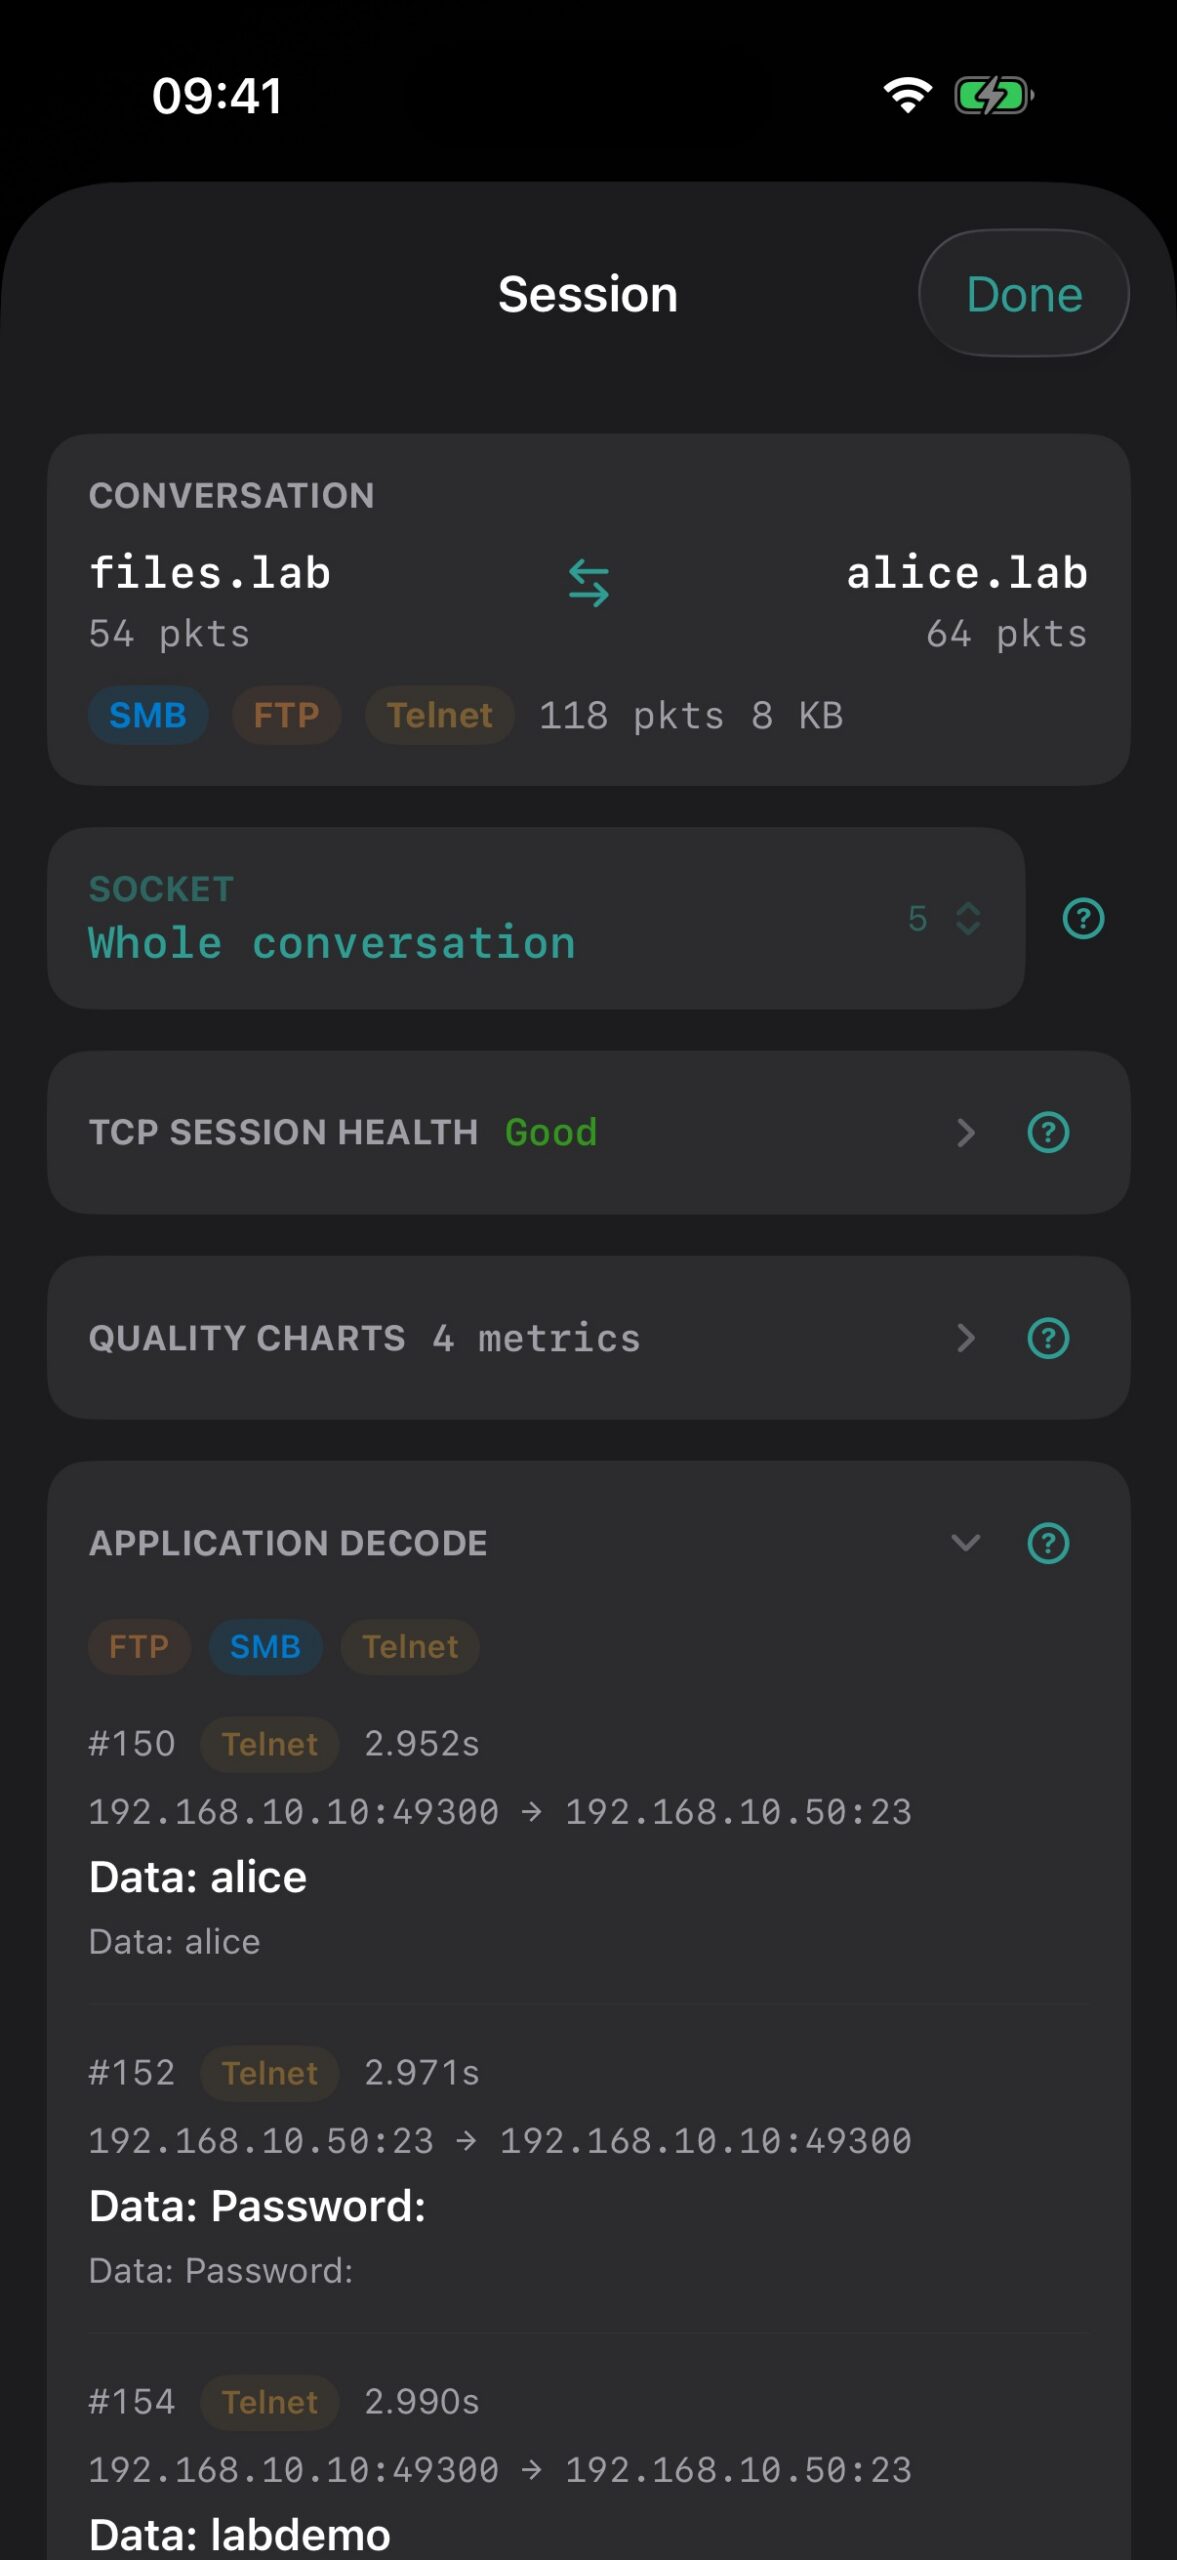
Session health, quality charts, TCP exchange ladder, Follow TCP Stream, application decode, and Options.
The use cases that make people lean in
1. “Just show me who’s talking.” You grabbed a PCAP off a SPAN/TAP/laptop. On the train home — or mid-meeting — open it on the phone and see the conversation map. Flip to Quality coloring and the sick pairs light up red (retransmits, RSTs, zero-window, poor score) without leaving the circle. No laptop, no boot time.
2. Teaching without a lab. Demo Mode is a story told in a circle — HTTP, DNS, SSH, Telnet, SMB, all lit up. Perfect for showing a junior (or a skeptical manager) what “conversation-first” troubleshooting means, without wiring up a network.
3. The map before the microscope. Use the circle and Talkers to spot the interesting IP pair/port, then jump to full Wireshark on a laptop with a proper display filter. PacketCircle finds the needle; Wireshark dissects it.
4. TCP health triage in your hand. Session details give a native health estimate (not Wireshark tcp.analysis): window, retransmissions, RST, SYN/FIN, zero-window events — plus Quality charts (ACK round trip, packet size, inter-arrival) so you can see the session breathe. Focus per TCP socket so one sick HTTPS port can’t hide behind a perfectly healthy SSH session on the same IP pair.
5. Payload peek, no laptop required. Follow TCP Stream for Telnet/HTTP-ish text with client/server coloring. The caps are deliberate — a phone isn’t a workstation — and Options lets you raise the budget when you mean it.
6. Customer site / air-gapped, guilt-free. No cloud account, no “upload your customer’s PCAP to our servers.” Open locally, analyze locally, delete when done. What happens on the phone stays on the phone.
Honest limits (and what Options can change)
A phone is not a laptop. PacketCircle is built for triage on a small screen, so a few caps are deliberate — and most of the tunable ones live in Options:
- Decode list — how many frames land in the Decode tab (default 5,000; Options raises up to 10,000).
- Follow TCP Stream budget — reassembly size (default 256 KB; Options slider 64–2048 KB). Raise it when you mean it; huge streams still truncate on purpose.
- Quality thresholds — lenient / balanced / strict bands for Excellent → Poor.
- Session focus — whole IP-pair vs per TCP socket for health.
- Circle Top N — 10 / 25 / 50 pairs drawn on the ring (Talkers lists all analyzed pairs).
- Show host names — optional shortened names from the capture’s own resolution traffic.
There’s no hard-coded maximum PCAP size, but memory and CPU still rule. On a recent iPhone, circle / gauges / talkers stay comfortable well past the sizes I typically throw at it. Personally, the largest capture I tickle day-to-day is around ~15 MB — and that opens with no major delay. The one place you may notice wait time is Follow TCP Stream on a chatty flow (it re-scans and reassembles payload under the budget). Bigger files can work; just don’t expect a multi-hundred-megabyte elephant to feel as snappy as Wireshark on a MacBook.
Decode depth is native and limited (reasonable IP/TCP, some app-layer peeks) — not Wireshark-class. That’s the trade for staying clean, offline, and App Store–shippable.
What it is honestly not
- Not a replacement for Wireshark’s full dissector tree — the decodes are native and intentionally lightweight.
- Not a live Wi-Fi sniffer on iPhone. See above; I’m not fighting Apple review.
- Not a mobile clone of the plugin — different codebase, different (smaller) coverage, nicer touch UI.
- Not open source on iOS — clean-room native Swift, precisely so it can live on the Store.
For the curious / future dev
1.1.0 already landed the conversation UX polish, Gauges quality panels, host names, and broader native decode described above. What’s still on my mind:
- “Is there a Mac version?” Yes — thanks to Swift/SwiftUI sharing the core, a macOS build already runs on my machine, in private Tech Preview. See the Updates & Blogs list for a sneak preview of what it can already do.
- “Android?” No idea yet. I’ll at least go find out what it would take — different language, different capture story, different store politics. Consider it “researching,” not “promising.”
- “iPad / tablet support?” Genuinely unsure. The extra screen real estate would suit the circle nicely — but is analyzing PCAPs on a tablet a real workflow for you, or a nice-to-have? Tell me. That feedback would actually move it up the list.
Status & links
- iOS: live on the App Store — 1.2.5.
- macOS Native: private Tech Preview — see the Updates & Blogs list.
- iOS Manual: PacketCircle iOS User Manual →
- Original Wireshark plugin (GPL): PacketCircle
Built by one packet nerd, for the packet community — with a lot of Cursor and a little obsession with circles.
Feedback — get in touch — helps a lot. What works, what’s missing, tablet use case or not: tell me.