PacketCircle iOS — User Manual
The iPhone/iPad half of PacketCircle Native: conversation topology, native TCP health, remote live capture over PCAP over IP, on-device Sanitize and PDF Report — a SwiftUI app on the same Rust analysis engine as the Mac, Linux and Windows apps.
1. Background and motivation
PacketCircle started as ideas from the open-source Wireshark plugin that drew host-to-host conversations as a circle. The native Apple apps (macOS and iOS) take that visualization further: open a PCAP/PCAPNG — or pull a live stream from a remote sensor — see who talks to whom, spot rough TCP health, and drill into a conversation, without shipping Wireshark or a GPL dissection stack inside the product.
What it is
A capture visualizer focused on conversation topology, talkers, native TCP session-quality estimates, and lightweight decode. As of 1.3.8: the Circle can group hosts by Networks, Expert findings tell a slow server from a slow network, and Compare, Decode, the PDF report and the Circle layouts run on the same Rust engine as the other apps. Since 1.2.5: the same Expert Alerts findings on Circle, Session, and Decode as the Mac app, plus native Sanitize Capture, Generate Report, and an Infrastructure Map Circle layout (Hosts → Services → Map). Decode has a Wireshark-style display filter (PacketCircle fields only) beside text/hex search. Opens PCAP, PCAPNG, gzip (.pcap.gz / .pcapng.gz), and Sniffer Pro .cap / .caz (Ethernet). Free of charge and unlimited — no ads, no in-app purchases, no telemetry, and it collects no data at all. Not open source (yet): built with the GPL in mind, but not published under GPL-2.0 today after a complete re-architecture; the sources will be released as soon as I feel comfortable, and if your organization wants to see them before that, just ask.
What it is not
PacketCircle is not a mobile Wireshark. It contains no open-source Wireshark / libwireshark dissection, and makes no claim of protocol parity with Wireshark’s dissectors, expert infos, or tcp.analysis fields. Application-layer decode is best-effort and limited: reasonable IP and TCP trees, hex, and some app-level recognition (HTTP request lines, DNS names, SSH banners, FTP/Telnet ASCII, SMB headers, TLS SNI where detectable, NetBIOS/Windows Browser). That is often enough to orient a lab or field capture — it is not comparable to Wireshark’s depth or accuracy. And it is not a local Wi-Fi/interface sniffer: a sandboxed App Store app cannot capture its own network traffic. PCAP over IP (below) is a live remote stream you pull in from a sensor you control — the phone never touches its own Wi-Fi or cellular traffic.
2. Getting started
| Step | Action |
|---|---|
| 1 | Install PacketCircle from the App Store. |
| 2 | On first launch, take the Guided tour, or open Options → Guided tour later. |
| 3 | Tap the folder control to import a PCAP or PCAPNG, connect to a remote sensor over PCAP over IP, or use the demo sample when the canvas is empty. |
| 4 | Explore Circle → Talkers / Session → Decode as needed. |
3. Main screens and functions
3.1 Circle
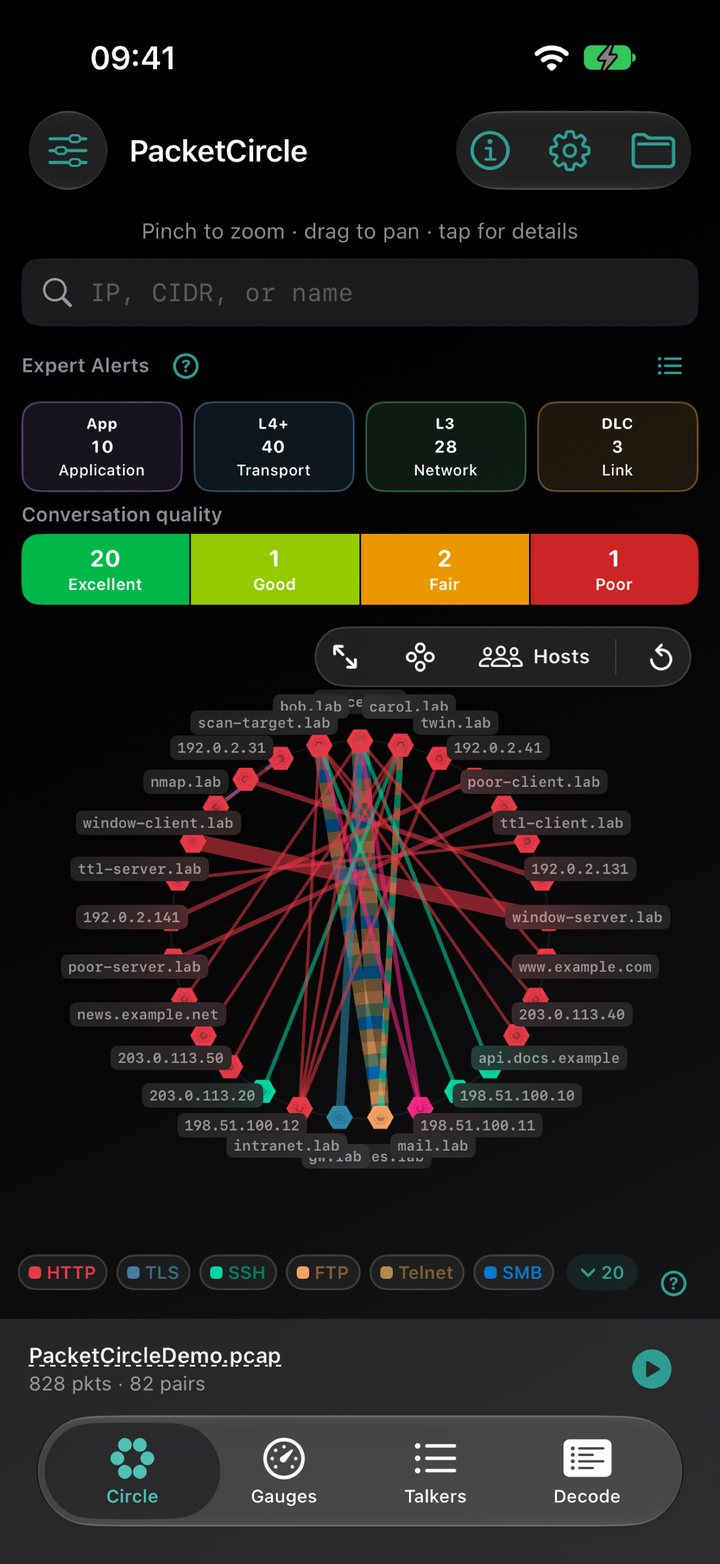
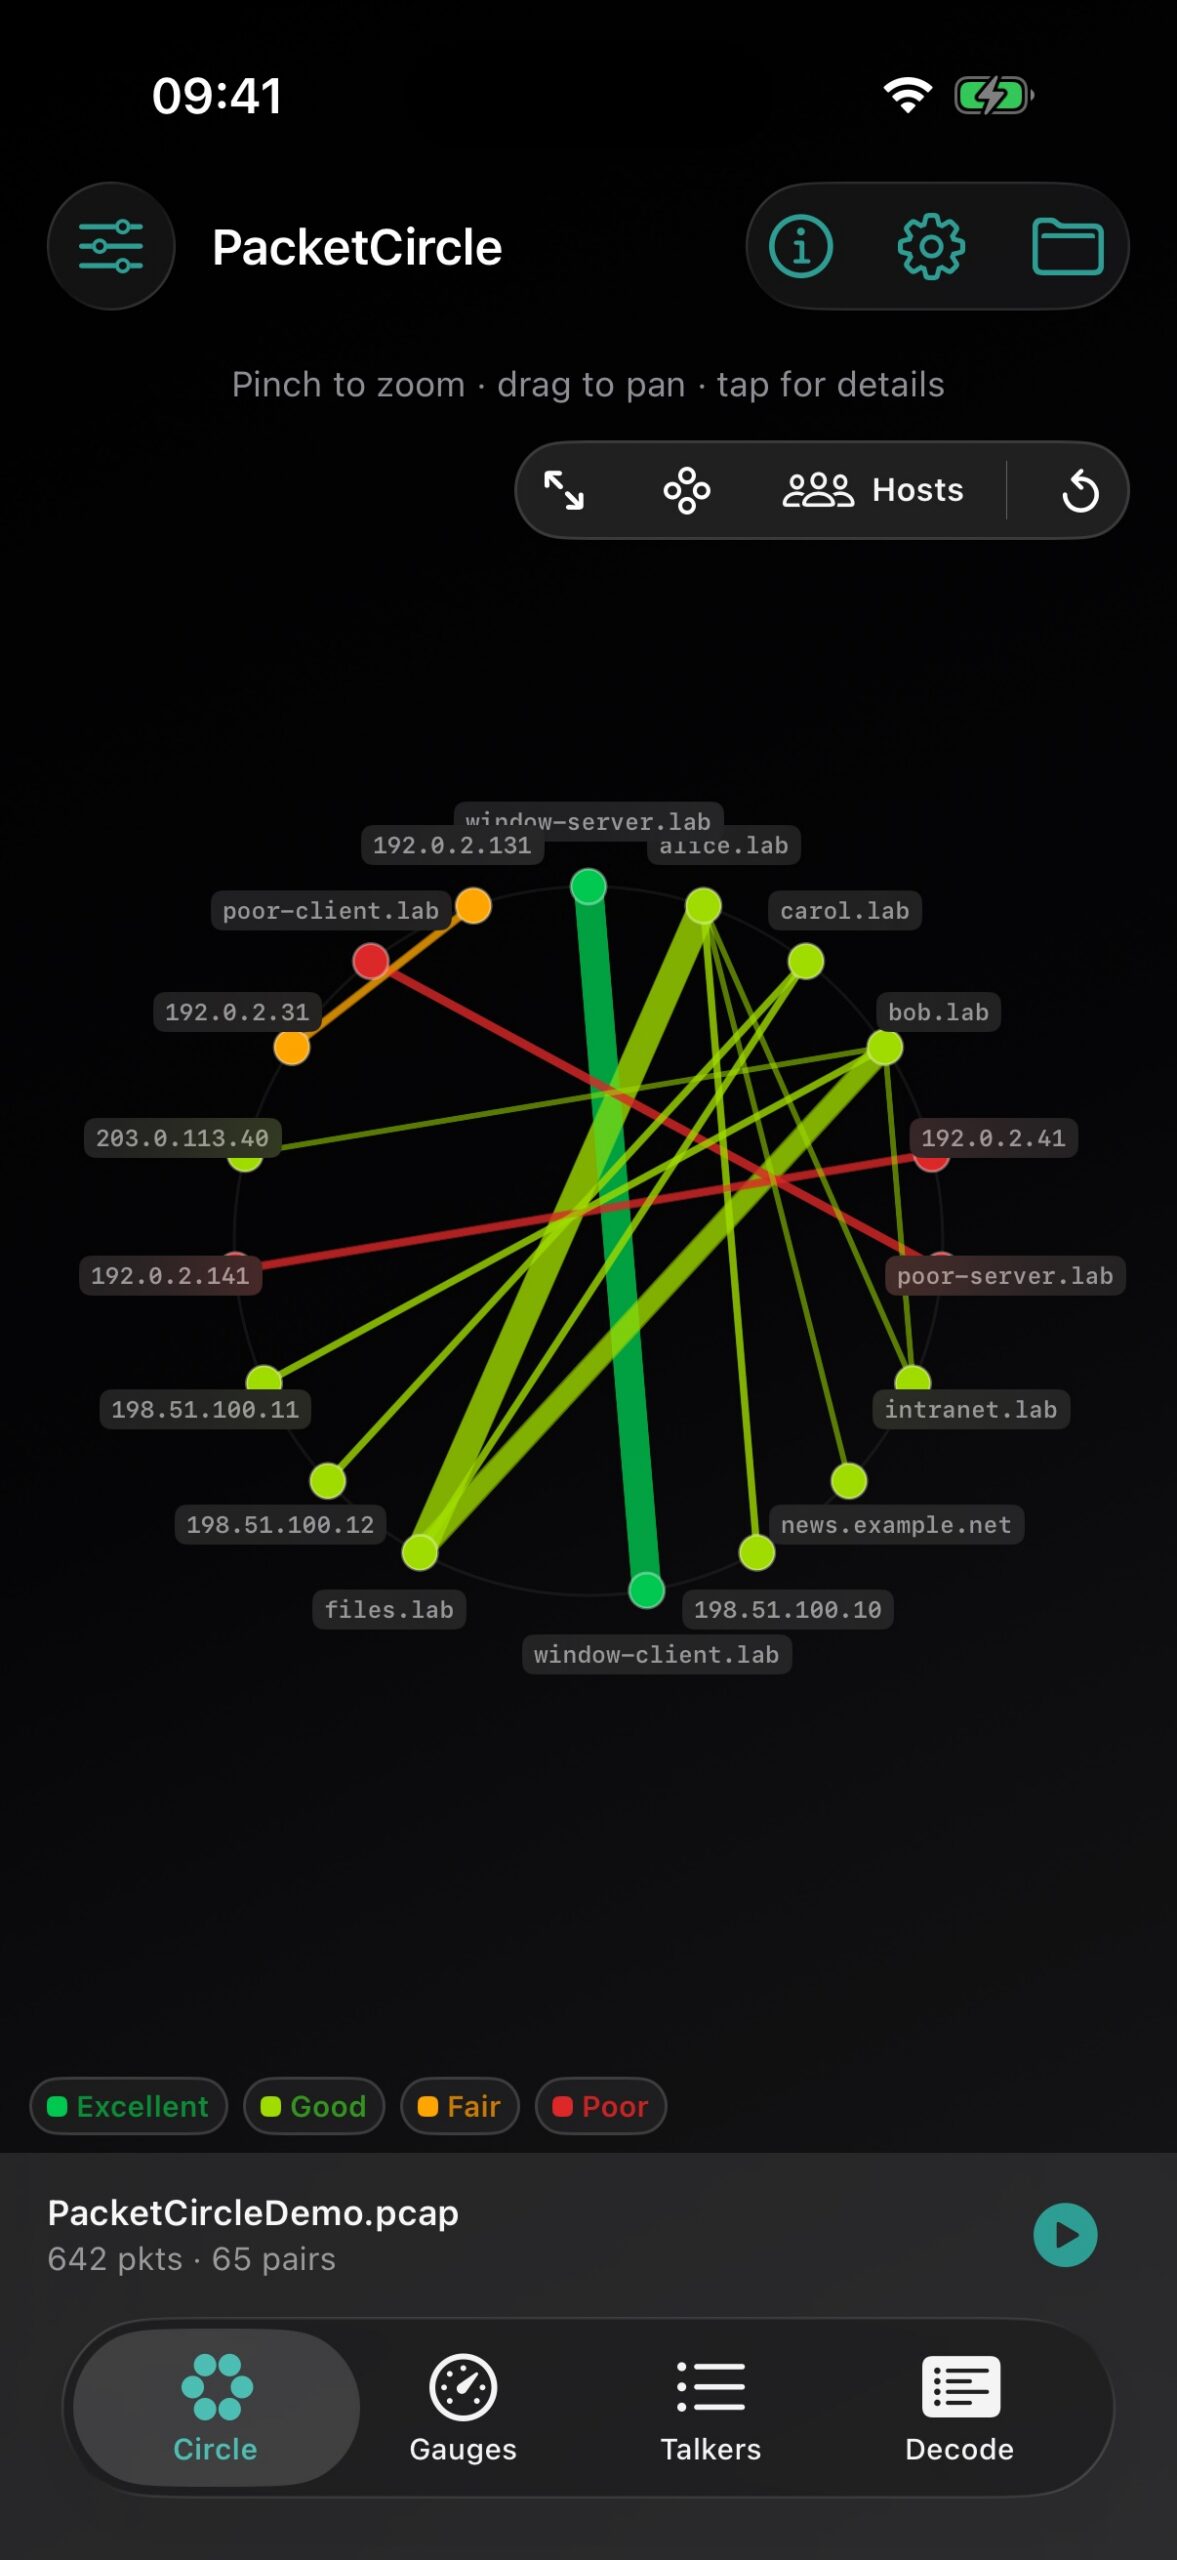
The Circle tab is the primary view: hosts on a ring, edges for conversations, color by protocol or quality.
| Layout | Shows |
|---|---|
| Hosts | Host-to-host conversations around the ring |
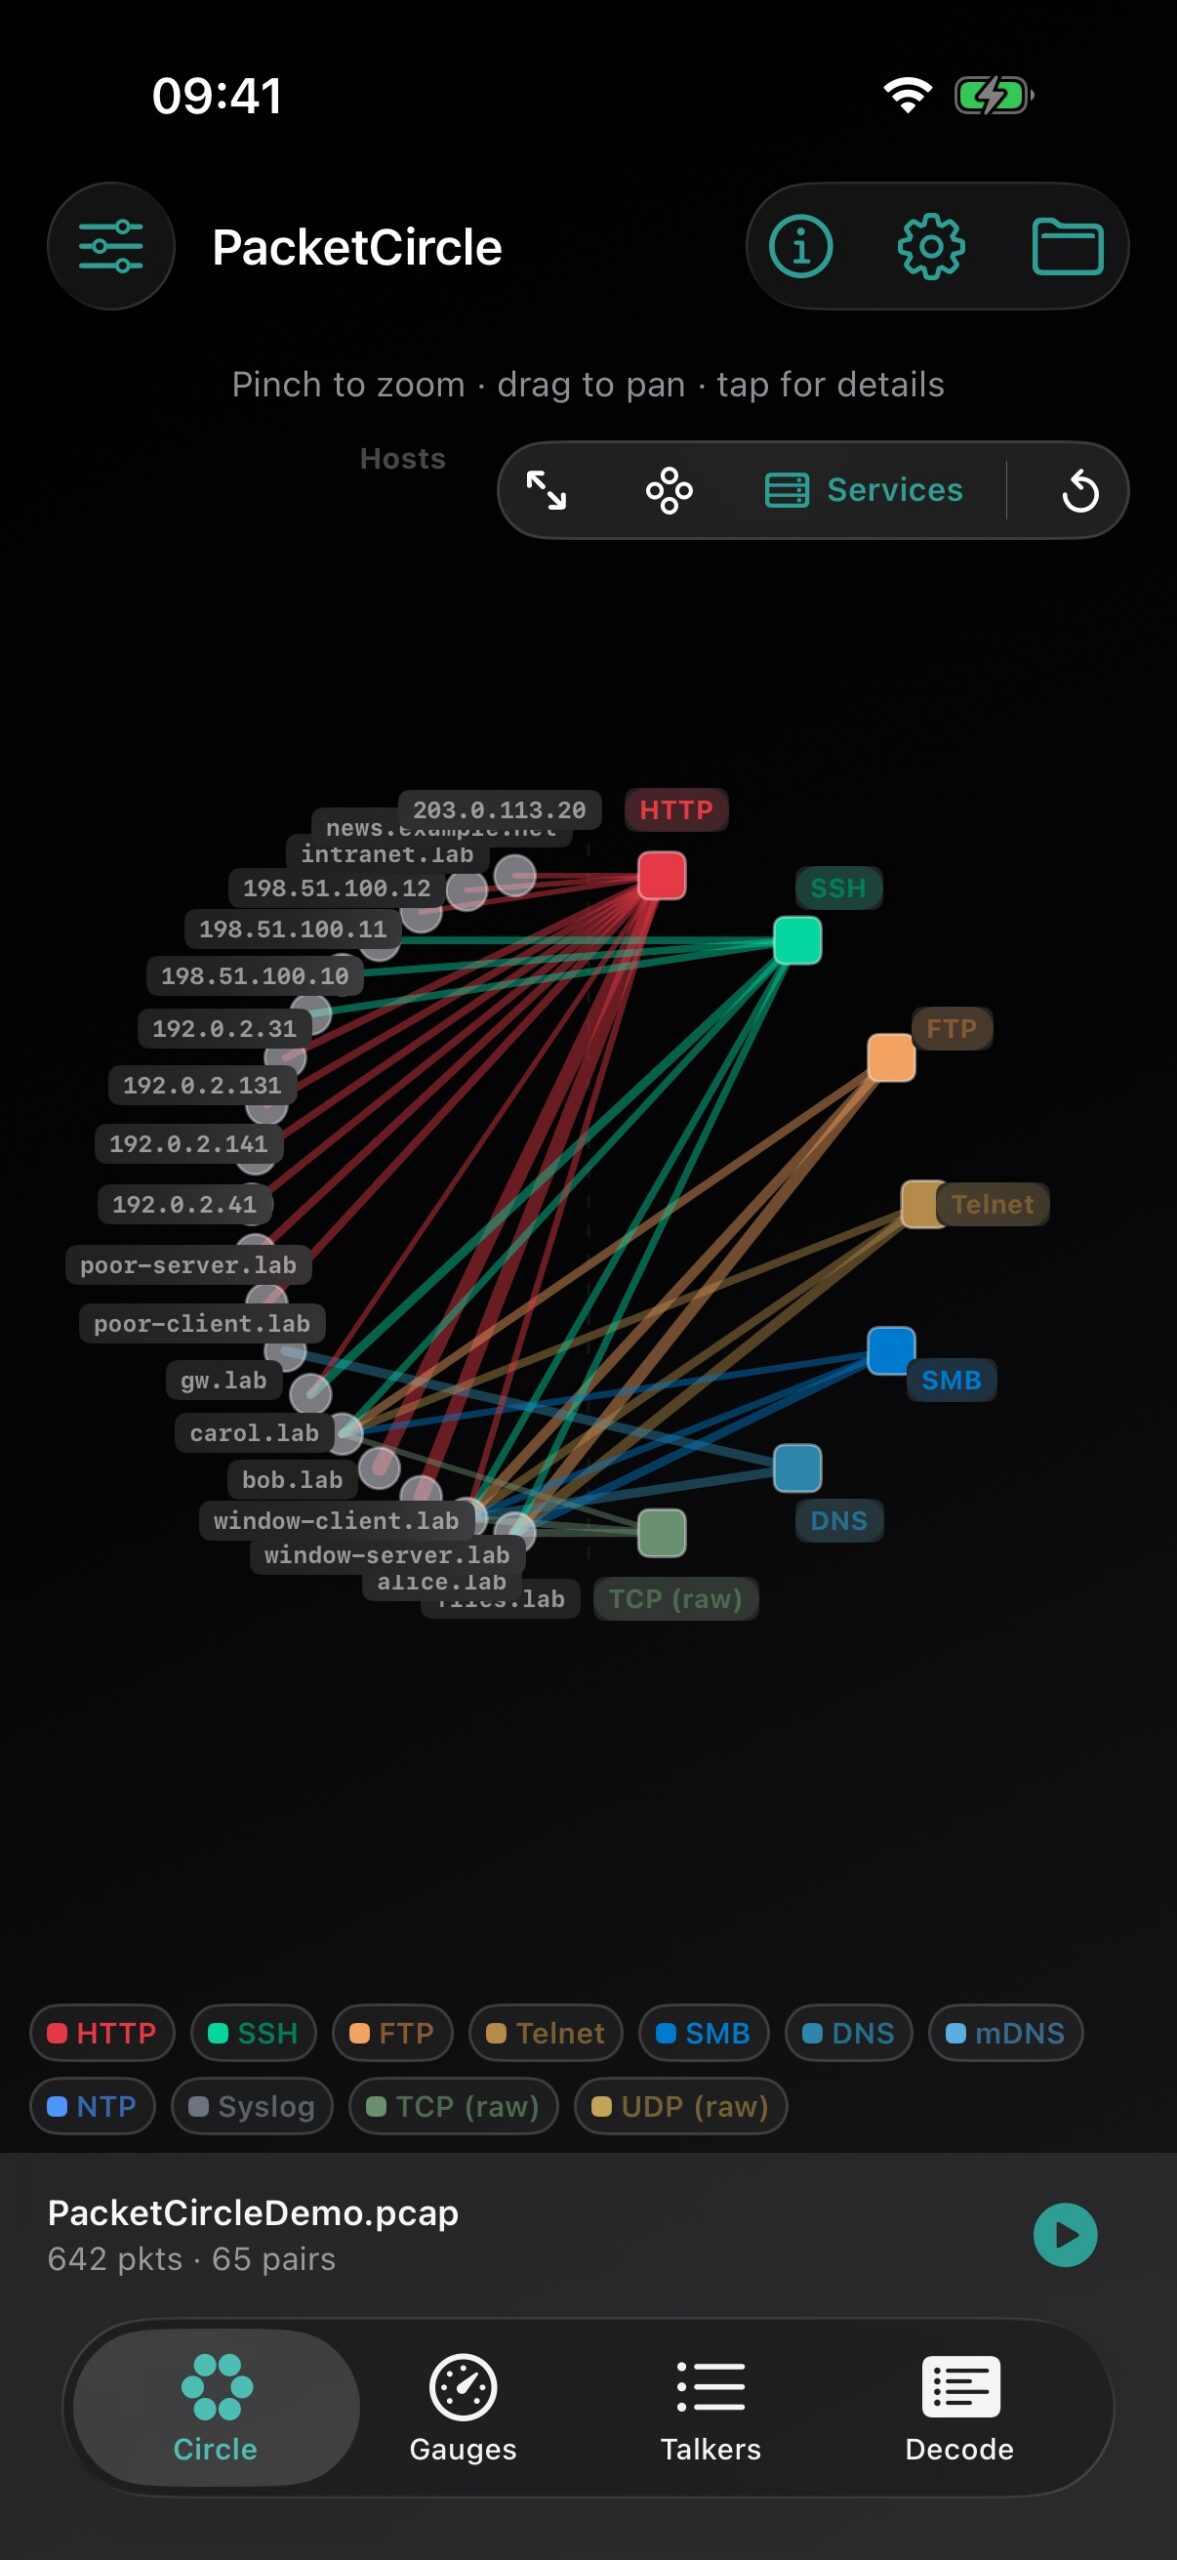
| Services | Hosts on one side, service ports on the other |
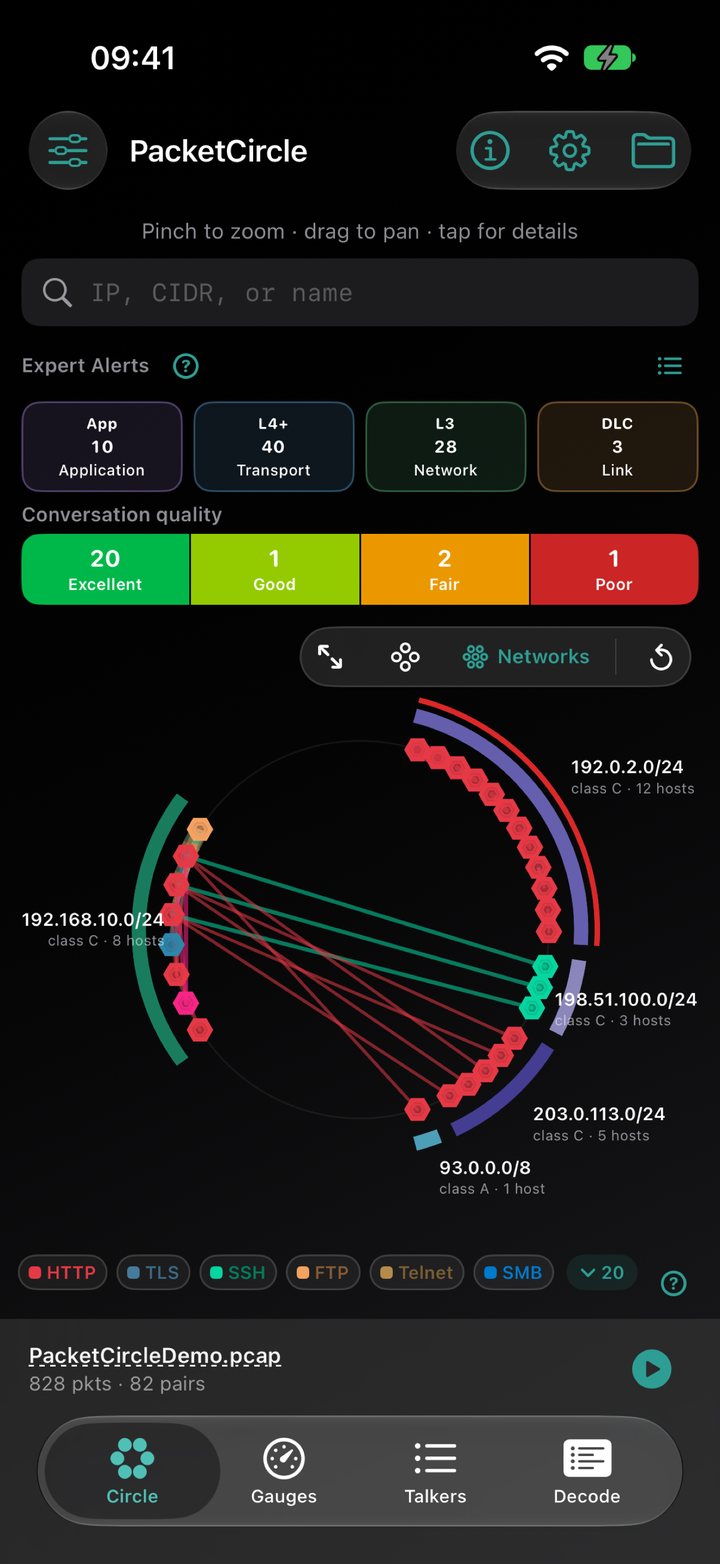
| Networks (1.3.8) | Hosts grouped by network: private networks on the left, the internet on the right, each network a coloured arc whose colour is the worst conversation quality in it. |
| Map (1.2.5+) | Infrastructure Map — Core / Distribution / Access, learned from STP, CDP, LLDP, OSPF, BGP, EIGRP, IS-IS, RIP and ARP in the capture. Tap a switch or router to open its Session details. Toggle off in Options → Circle → Show Infrastructure Map. |
Networks layout (1.3.8)
Tap an arc to open that network (its hosts, packets and data, with Copy Wireshark Filter and Copy BPF Filter); double-tap an arc to fold it into one block. Host names on the ring appear when you zoom in, or for the host you select; the arcs carry the network names. Name your own networks under Options → Circle → Known networks (for example 10.1.0.0/16 as Office LAN); the most specific entry wins.
When a capture has many protocols, the legend folds to one row with a count button that opens it again. While you type in the search field the Circle keeps its room: the hint, Expert Alerts, quality bar, legend and file bar step aside, and the keyboard closes on Search or when you touch the Circle. Type expert in the search to list the worst findings of the capture first.
Under search: Expert Alerts (App / L4+ / L3 / DLC) then the conversation quality bar — both can be hidden in Options → Circle. Tap a band to filter; touch-and-hold a chip opens that band’s alert list.
3.2 Session details
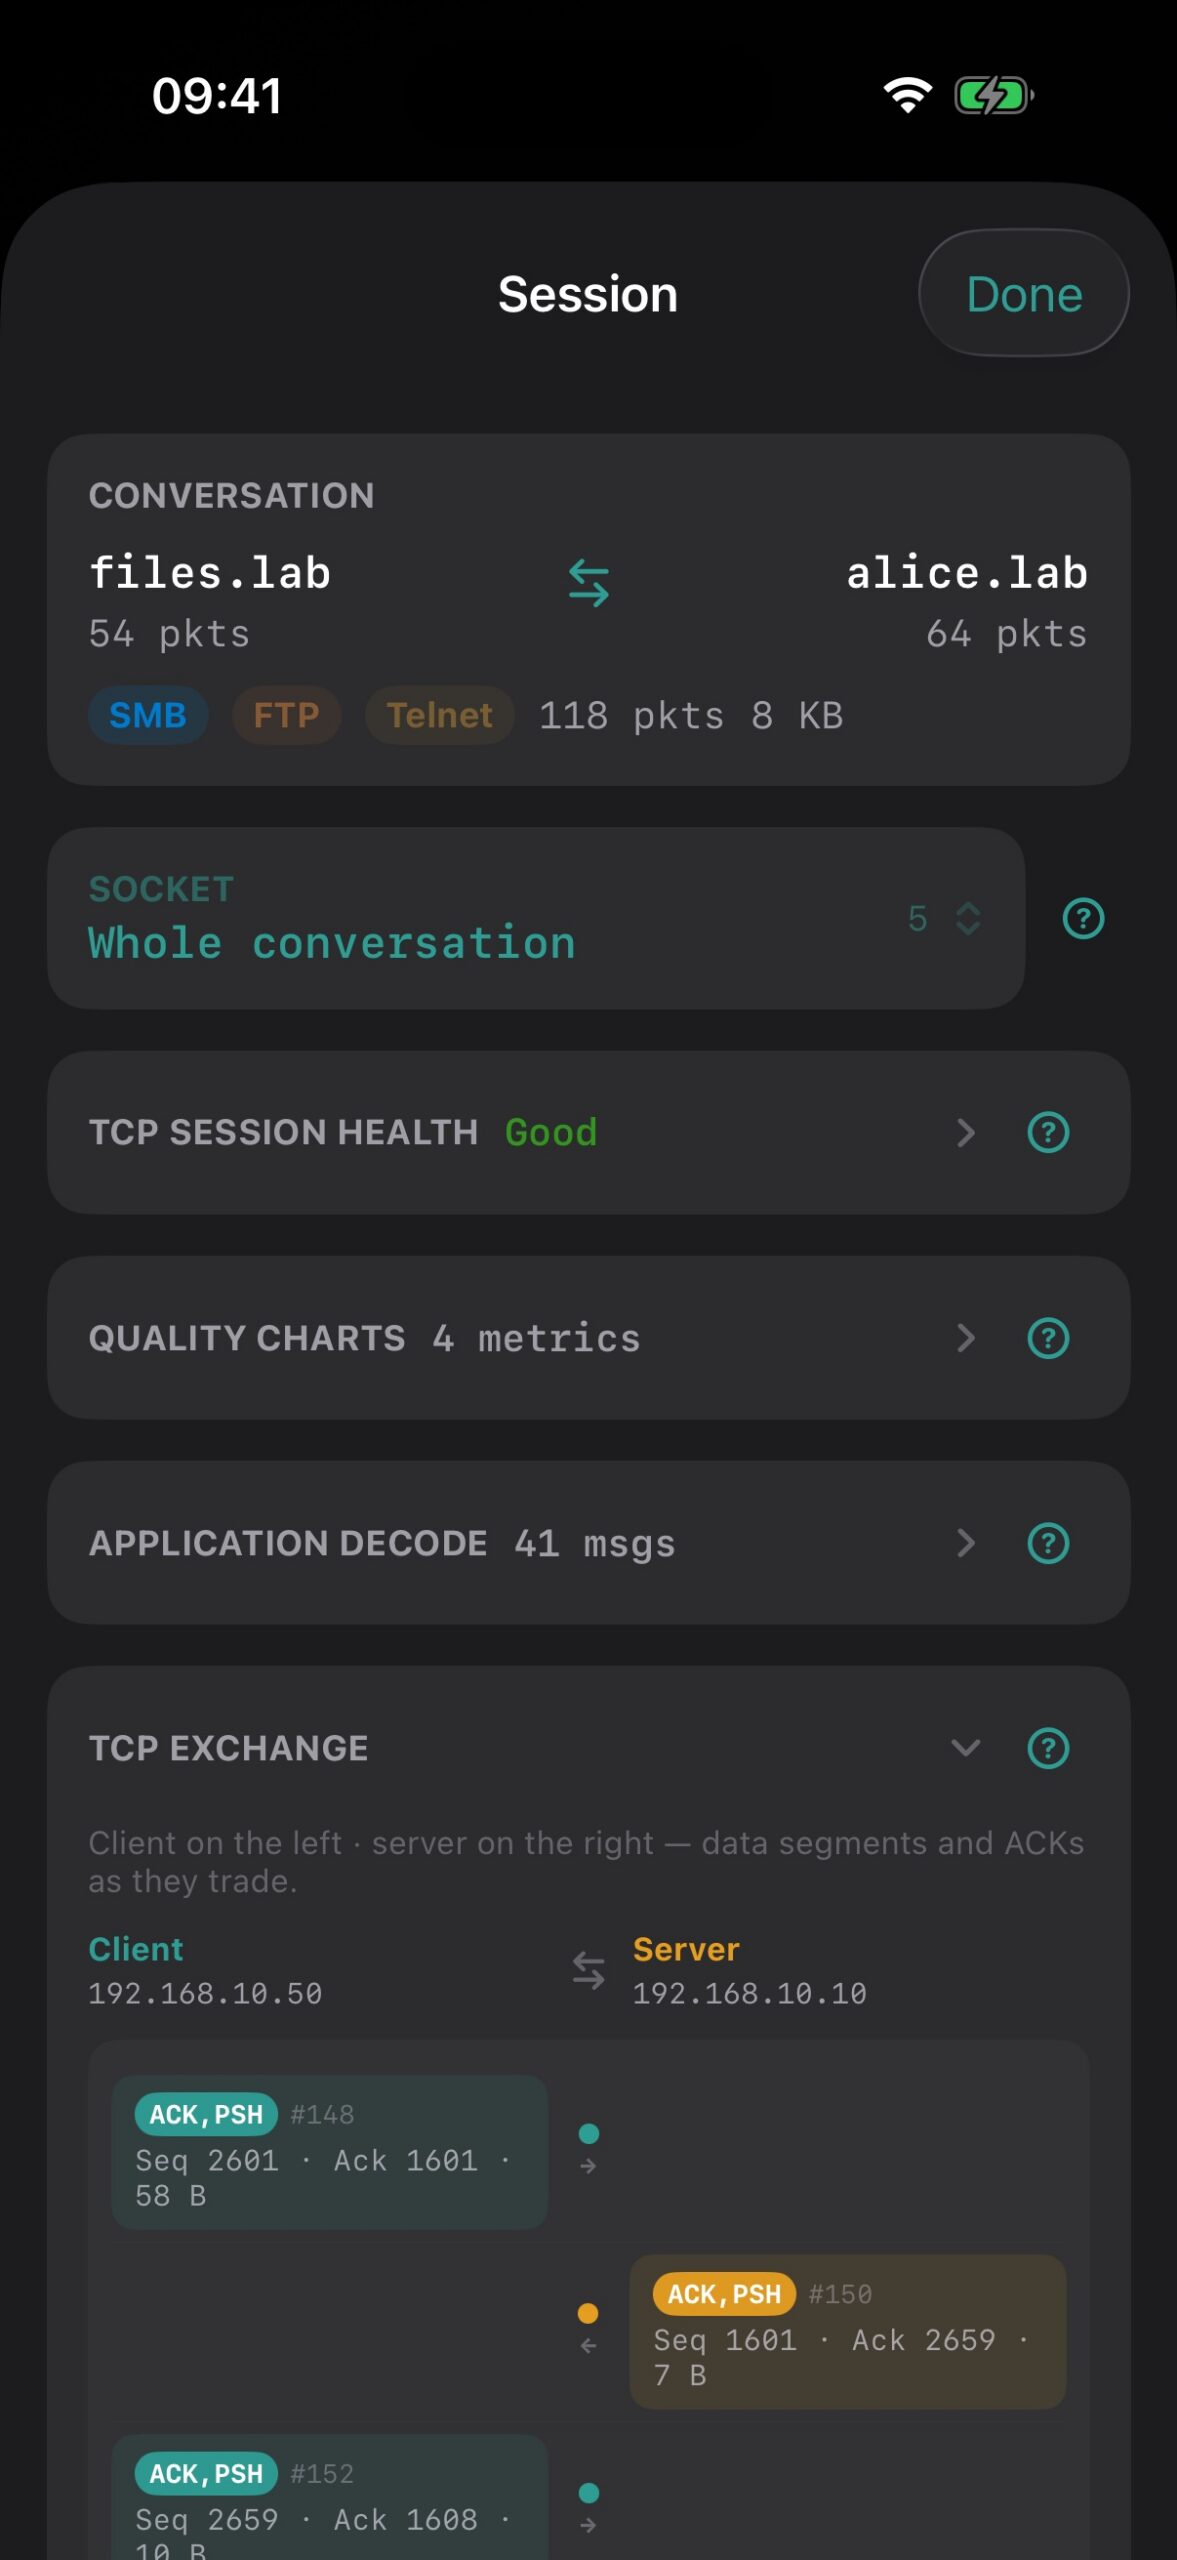
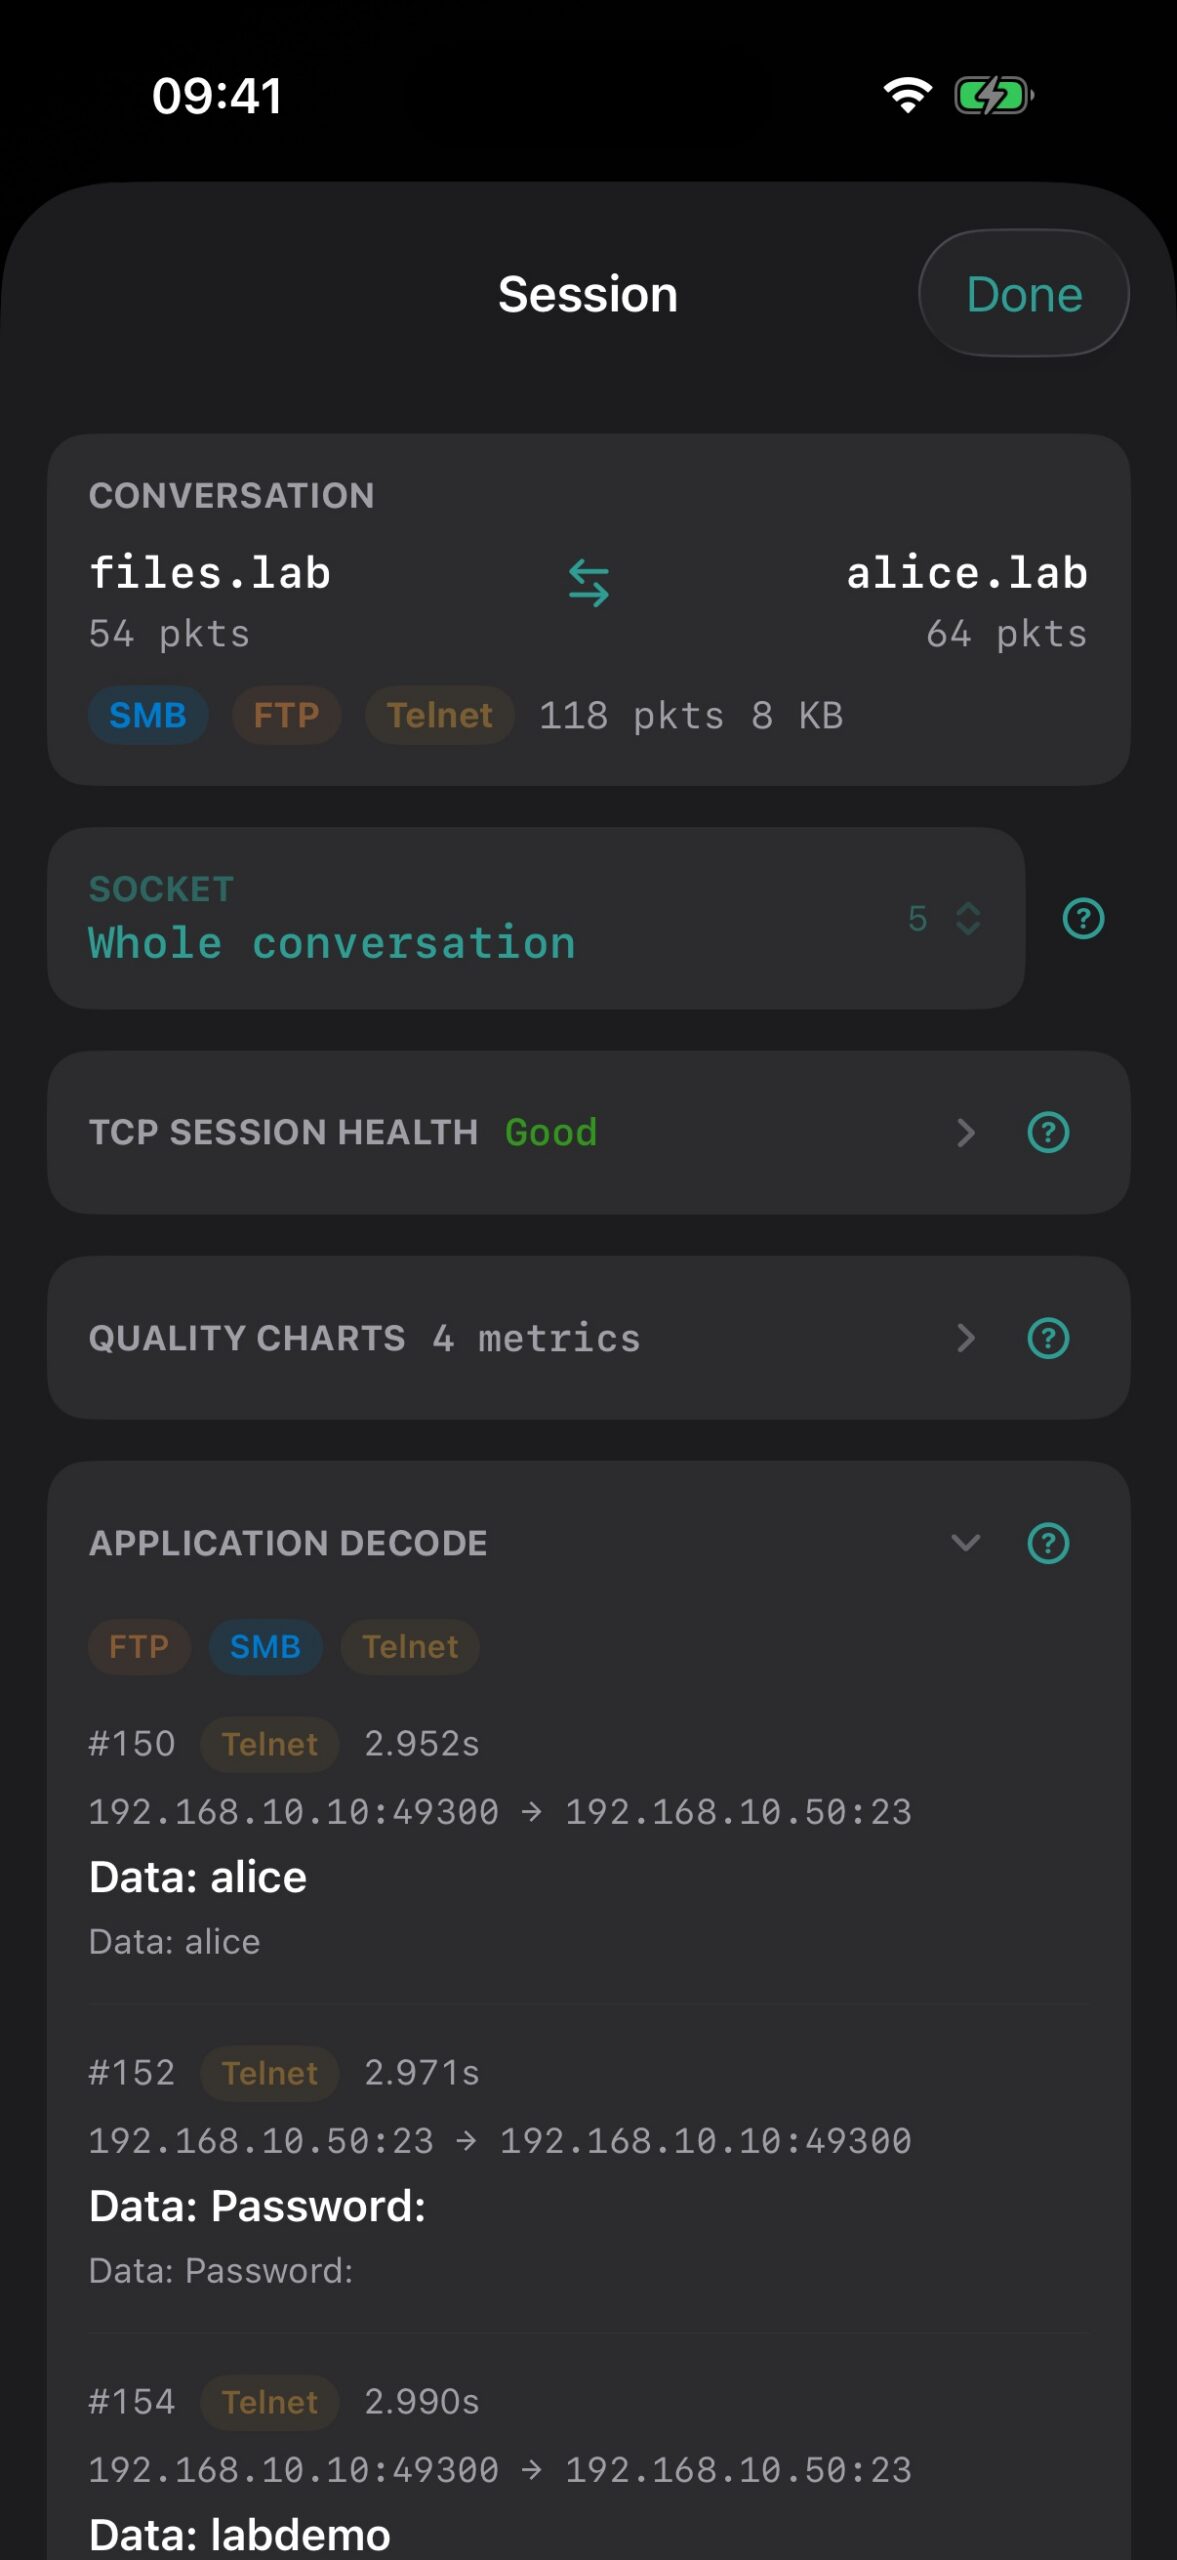
Tap a conversation to open Session: conversation summary, socket picker, Expert findings for the selected socket, TCP session health, quality charts, and actions such as Follow TCP Stream.
Slow server or slow network? (1.3.8) For a TCP conversation, Expert now splits the wait into the handshake round trip and the server’s think time, and says which one dominates.
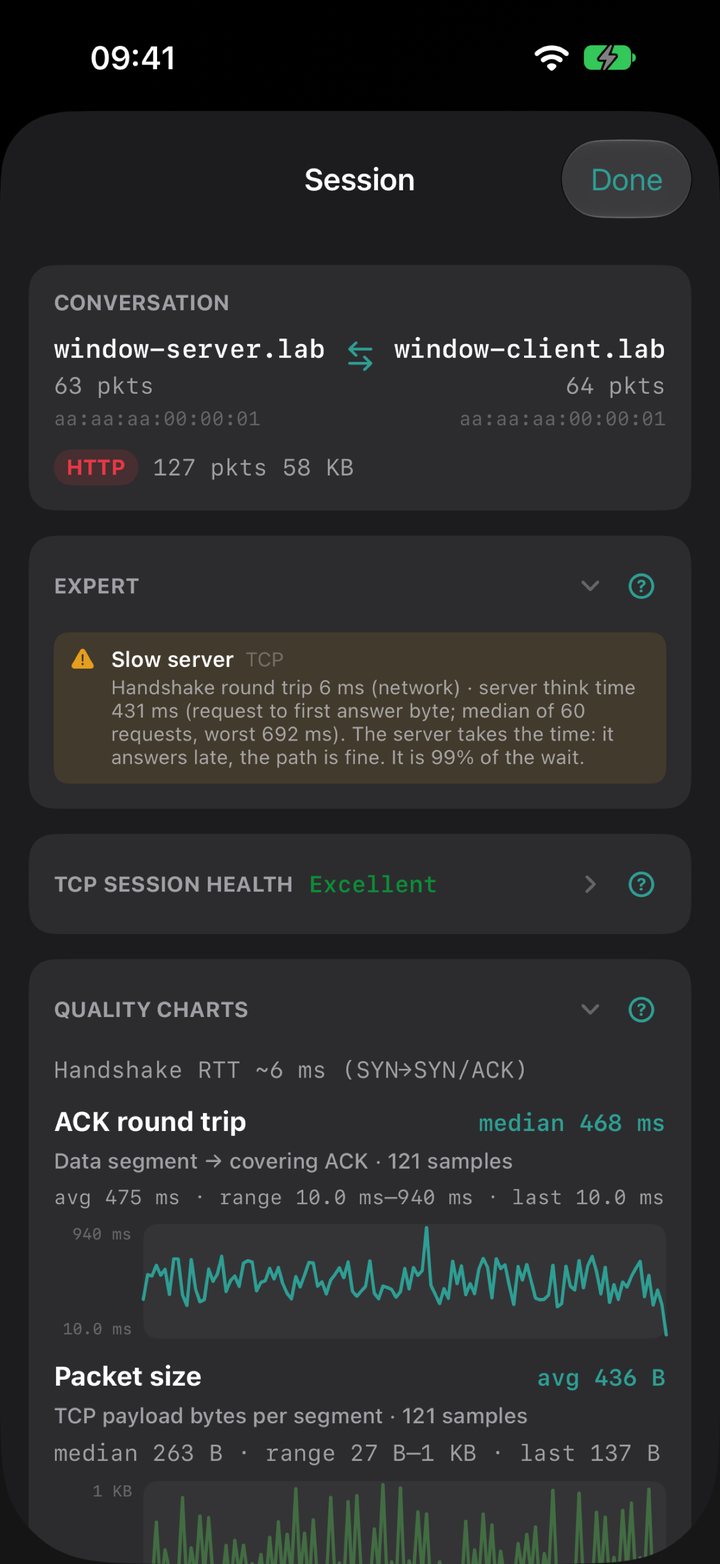
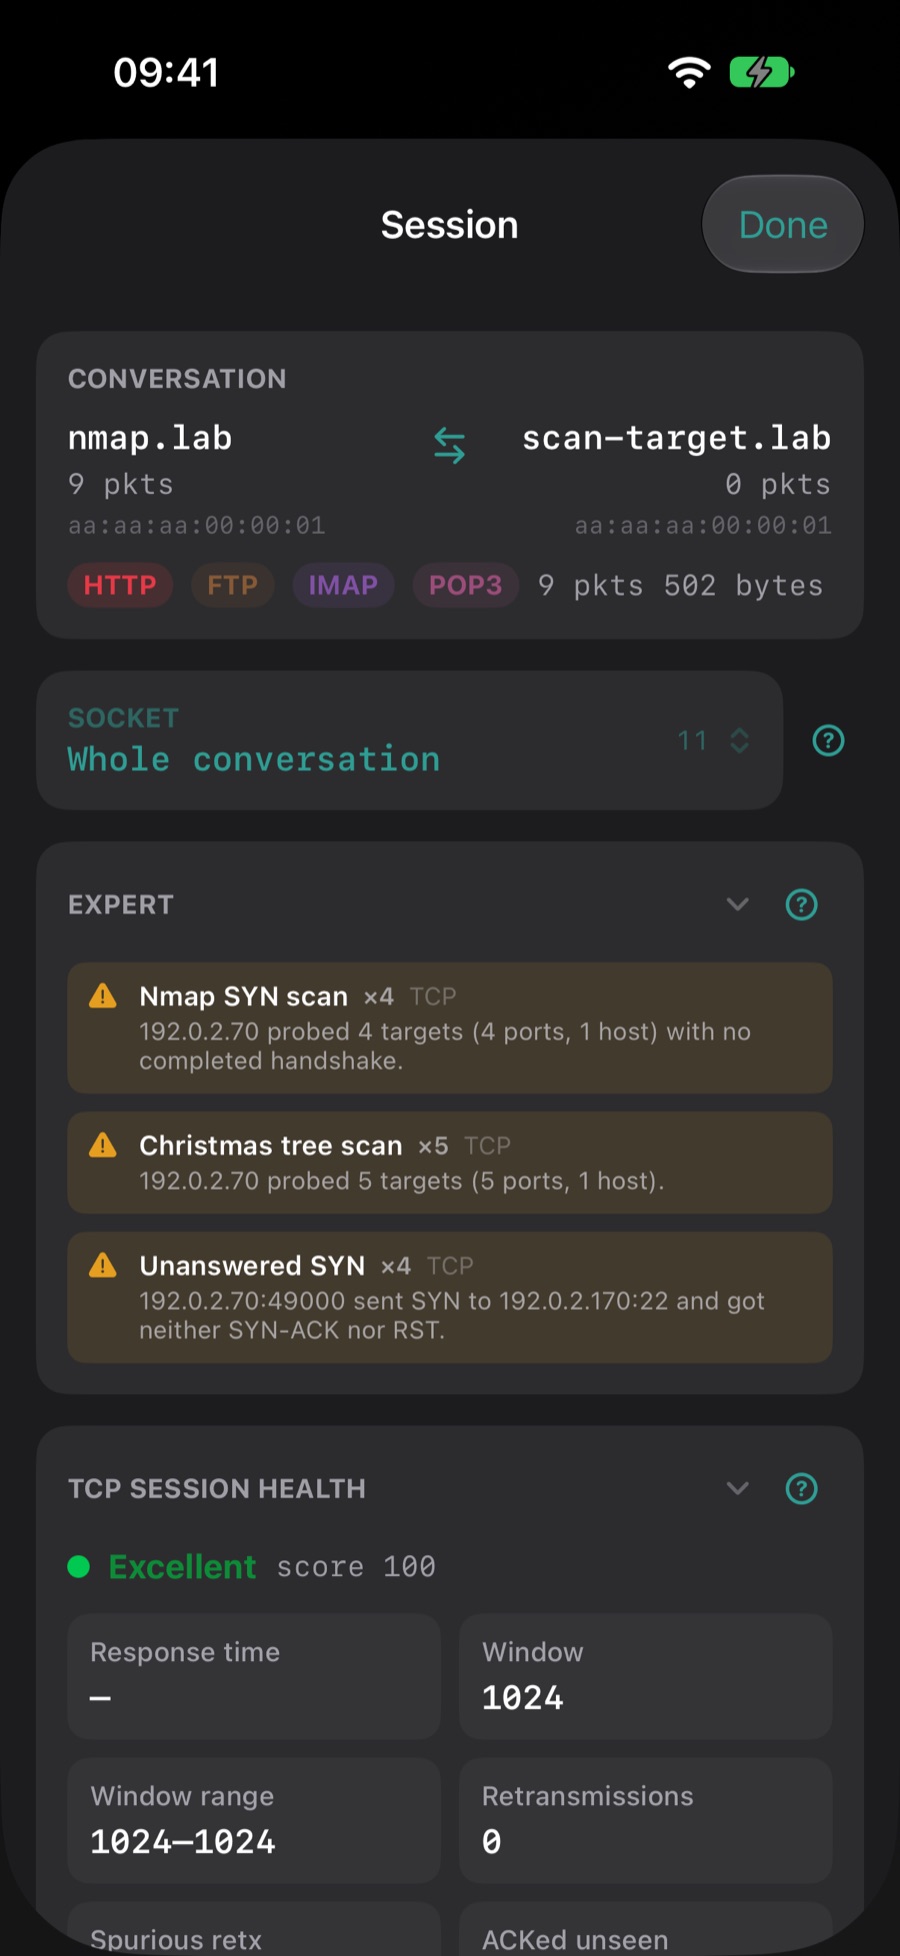
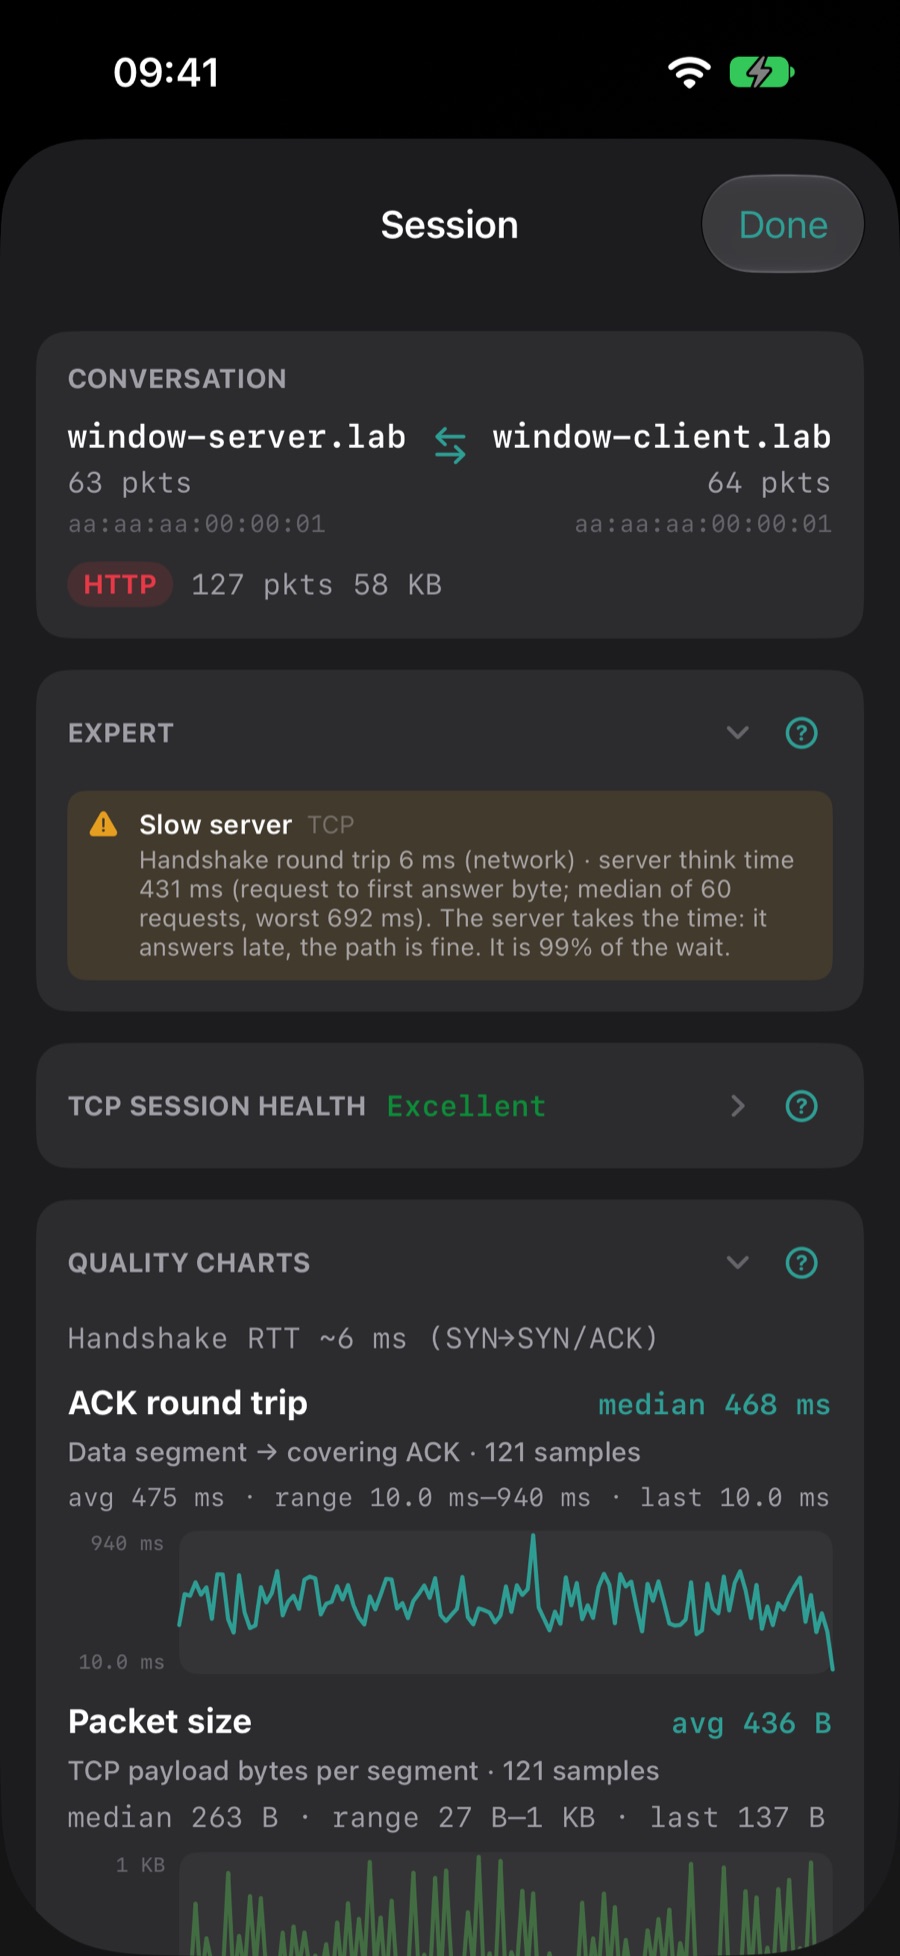
Expert follows the socket (1.2.6): pick a socket (for example TCP 80) and the Expert list shows only that service’s findings, that socket’s TCP health, and host-wide network/link findings — not FTP or mail alerts from the same pair of hosts. A short note flags when more findings sit on other sockets. An Other sockets list at the bottom switches sockets in one tap, with a warning marker on the ones that have alerts; Whole conversation is one tap away.
3.3 Follow TCP Stream
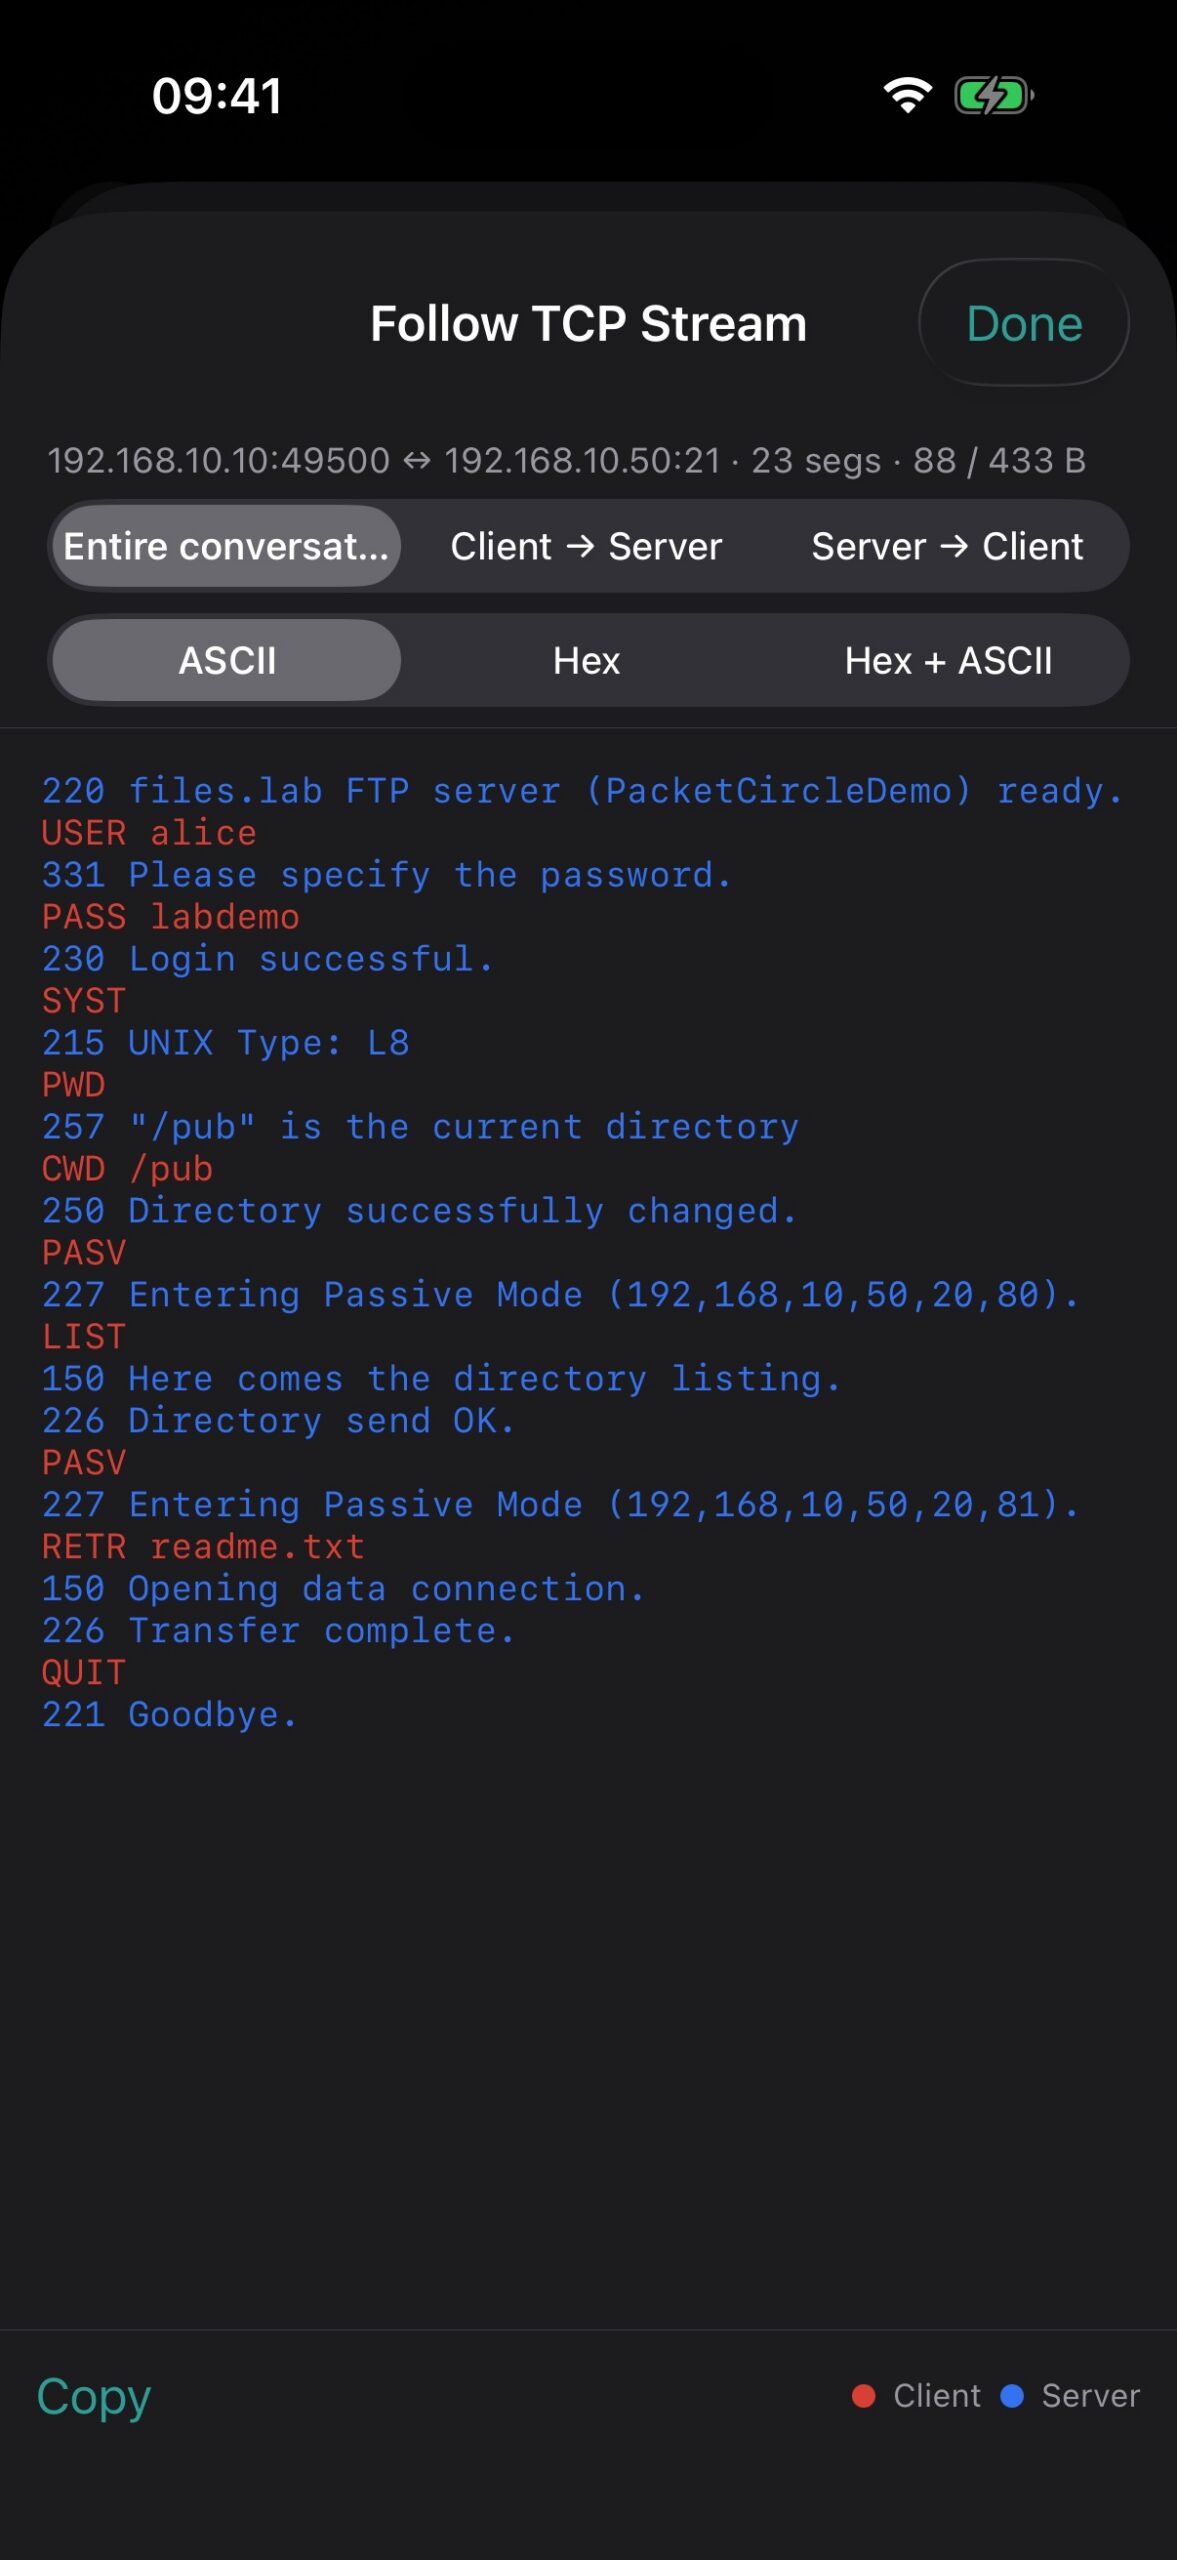
From Session, open Follow TCP Stream to reassemble payload bytes for one TCP flow (budget-limited on device).
3.4 Talkers
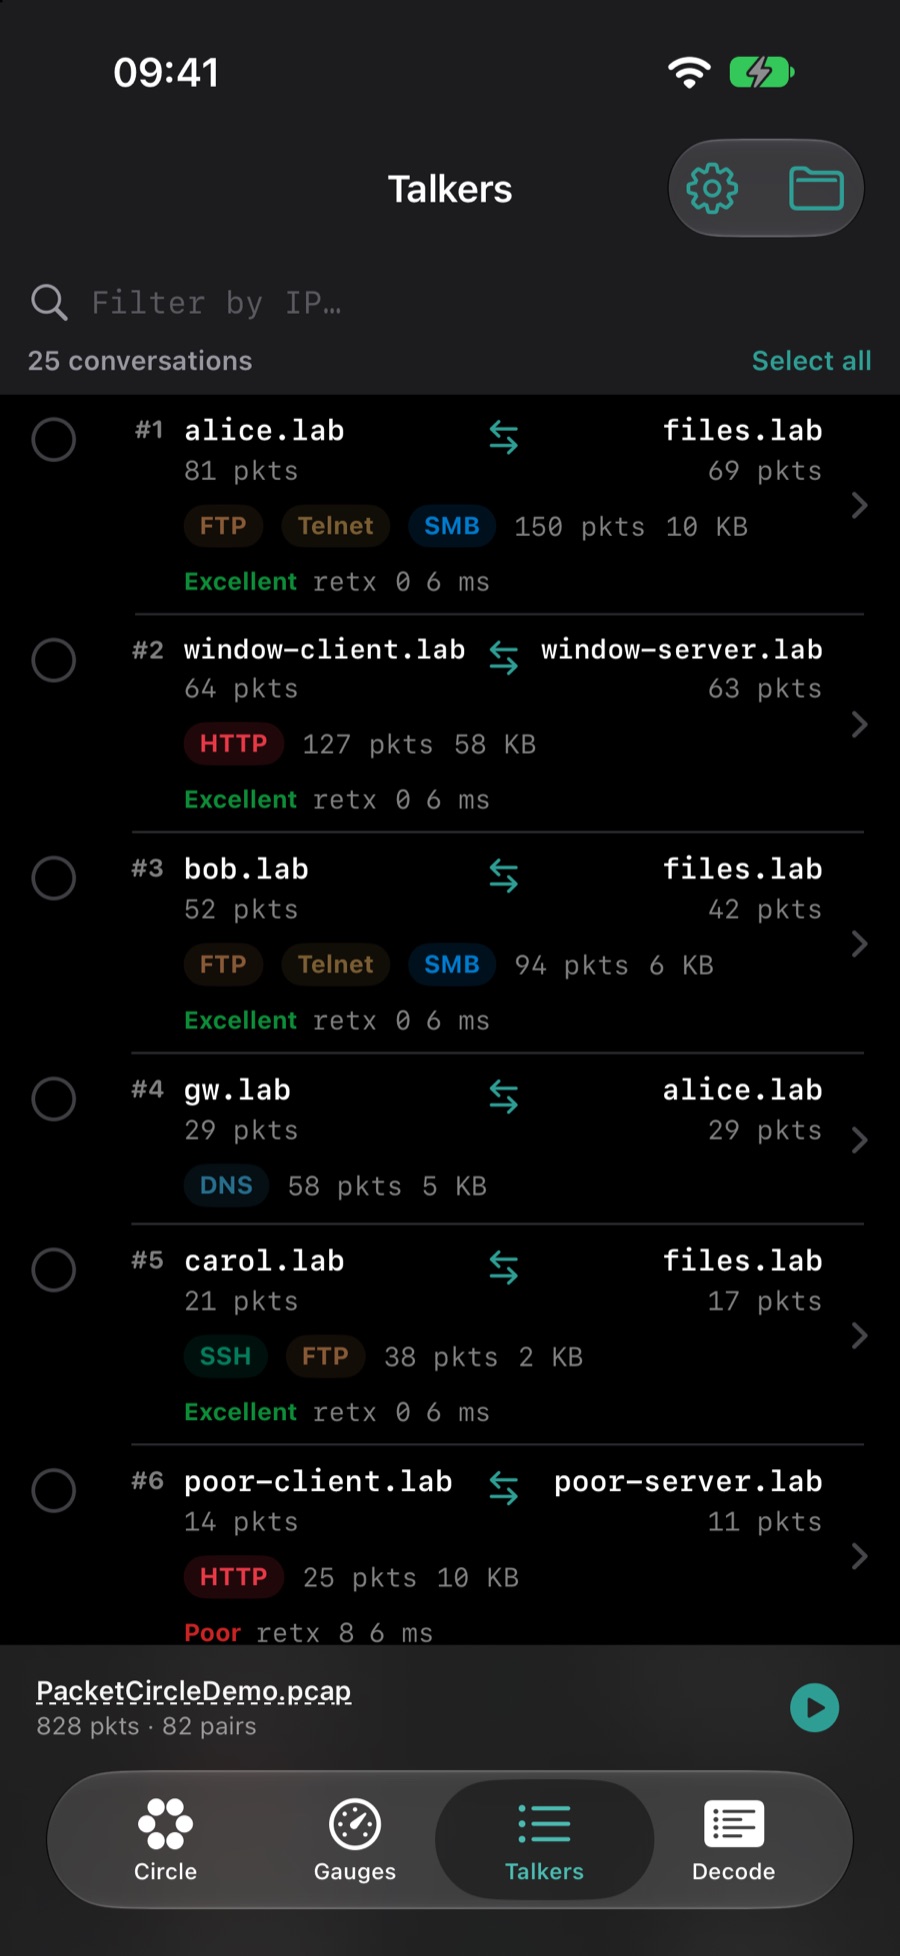
List of analyzed IP pairs ranked by volume, with protocol chips, quality grade, and TCP hints. Filter by IP; limit top 10 / 25 / 50. Tap a row for Session.
3.5 Gauges
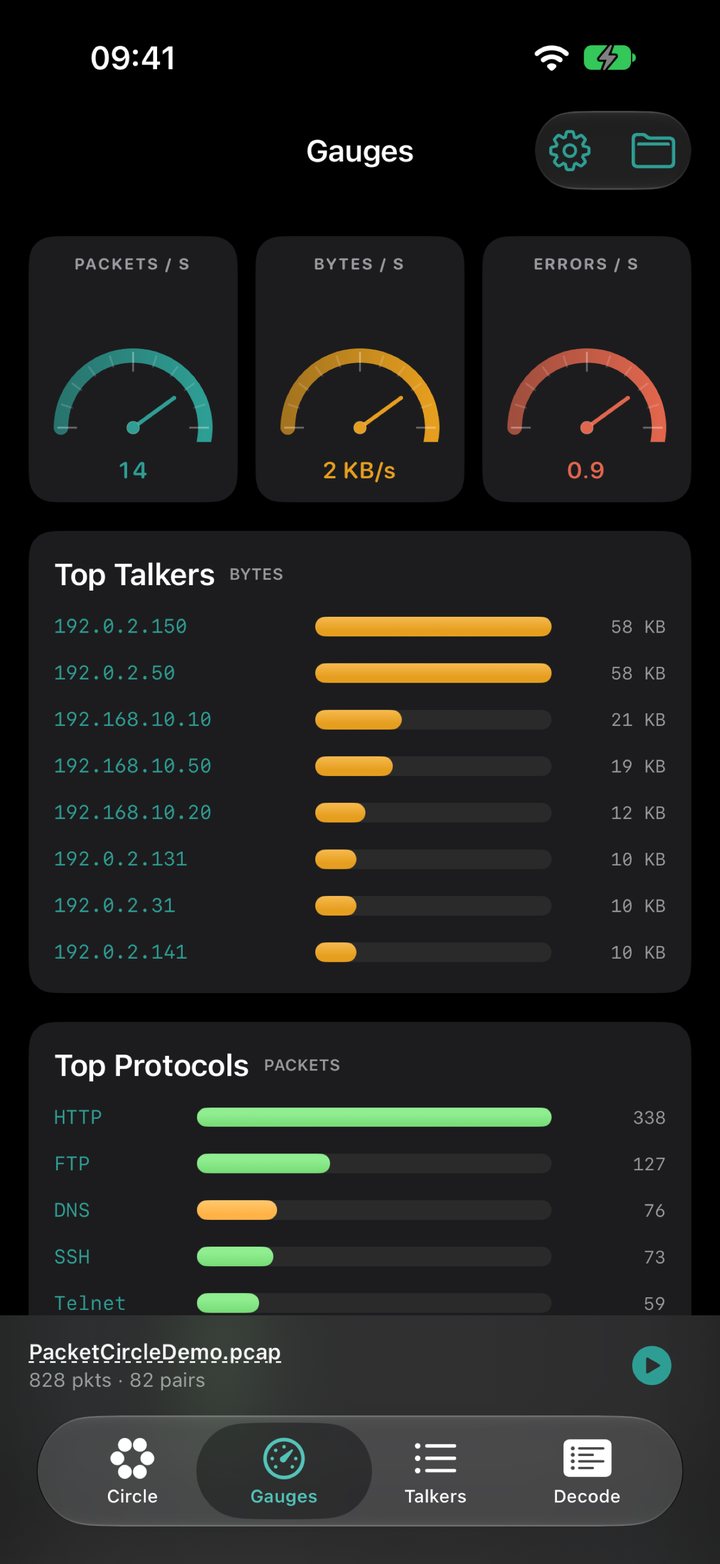
High-level rates and distributions: packets/s, bytes/s, errors/s, top talkers by bytes, top protocols by packets, and Degraded Quality Conversations.
3.6 Decode
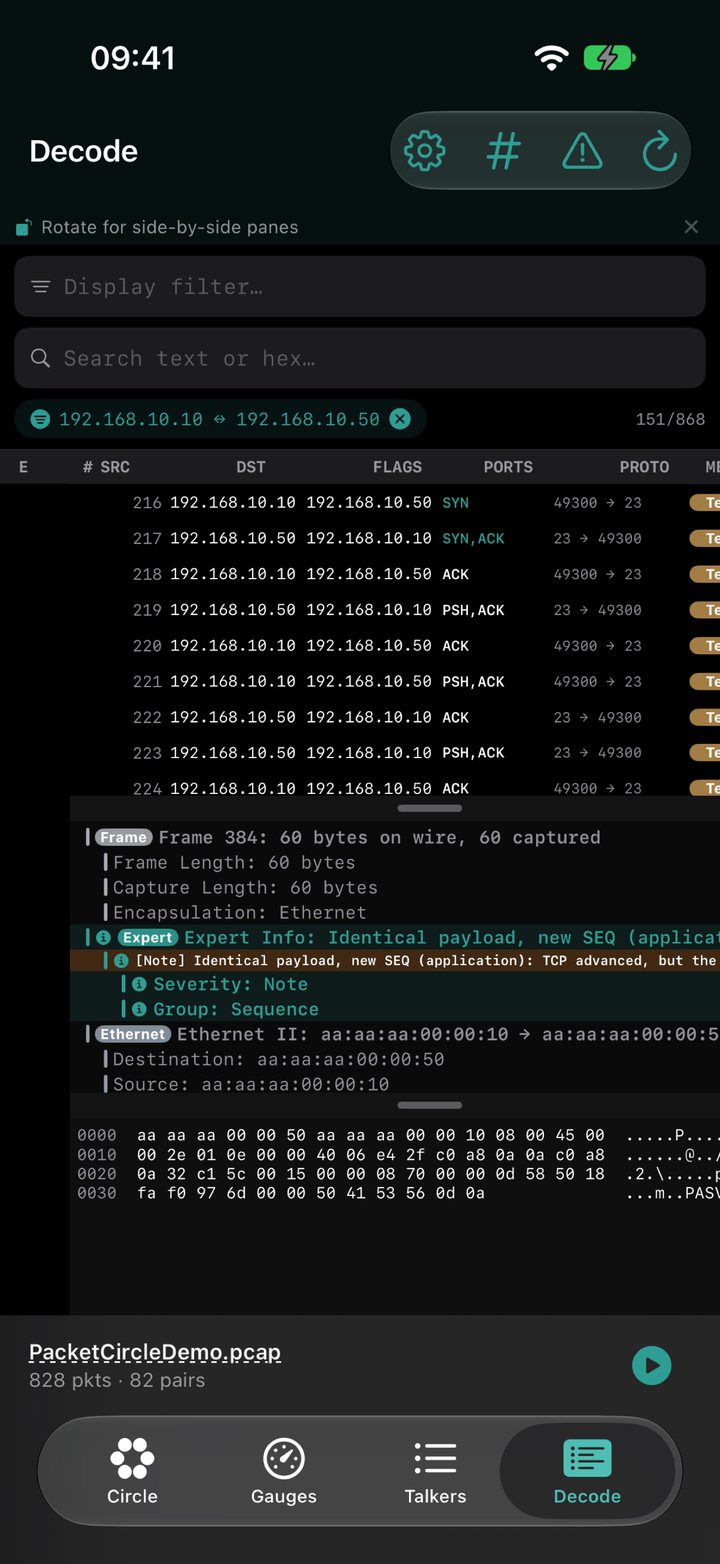
Packet list + protocol tree + hex/ASCII for frames loaded into the Decode budget (default 5,000; Options can raise it). A Wireshark-style display filter sits beside text/hex search, with autocomplete limited to fields PacketCircle actually decodes — unknown names turn the box red instead of silently matching. Per-frame Expert Info (severity tint) appears when a single packet is enough to raise it.
3.7 PCAP over IP — remote capture (1.2.5)
PacketCircle connects out to a remote pcap stream (TCP@host:57012), the same convention Wireshark uses with -k -i TCP@host:port. The phone never sniffs its own Wi-Fi or cellular traffic — the other side must already be sending a PCAP stream, for example from the pcapoverip broker (single-file, free, GPL-2.0) or PolarProxy. See PacketTools → PCAP over IP for the broker link and a diagram of how it works.
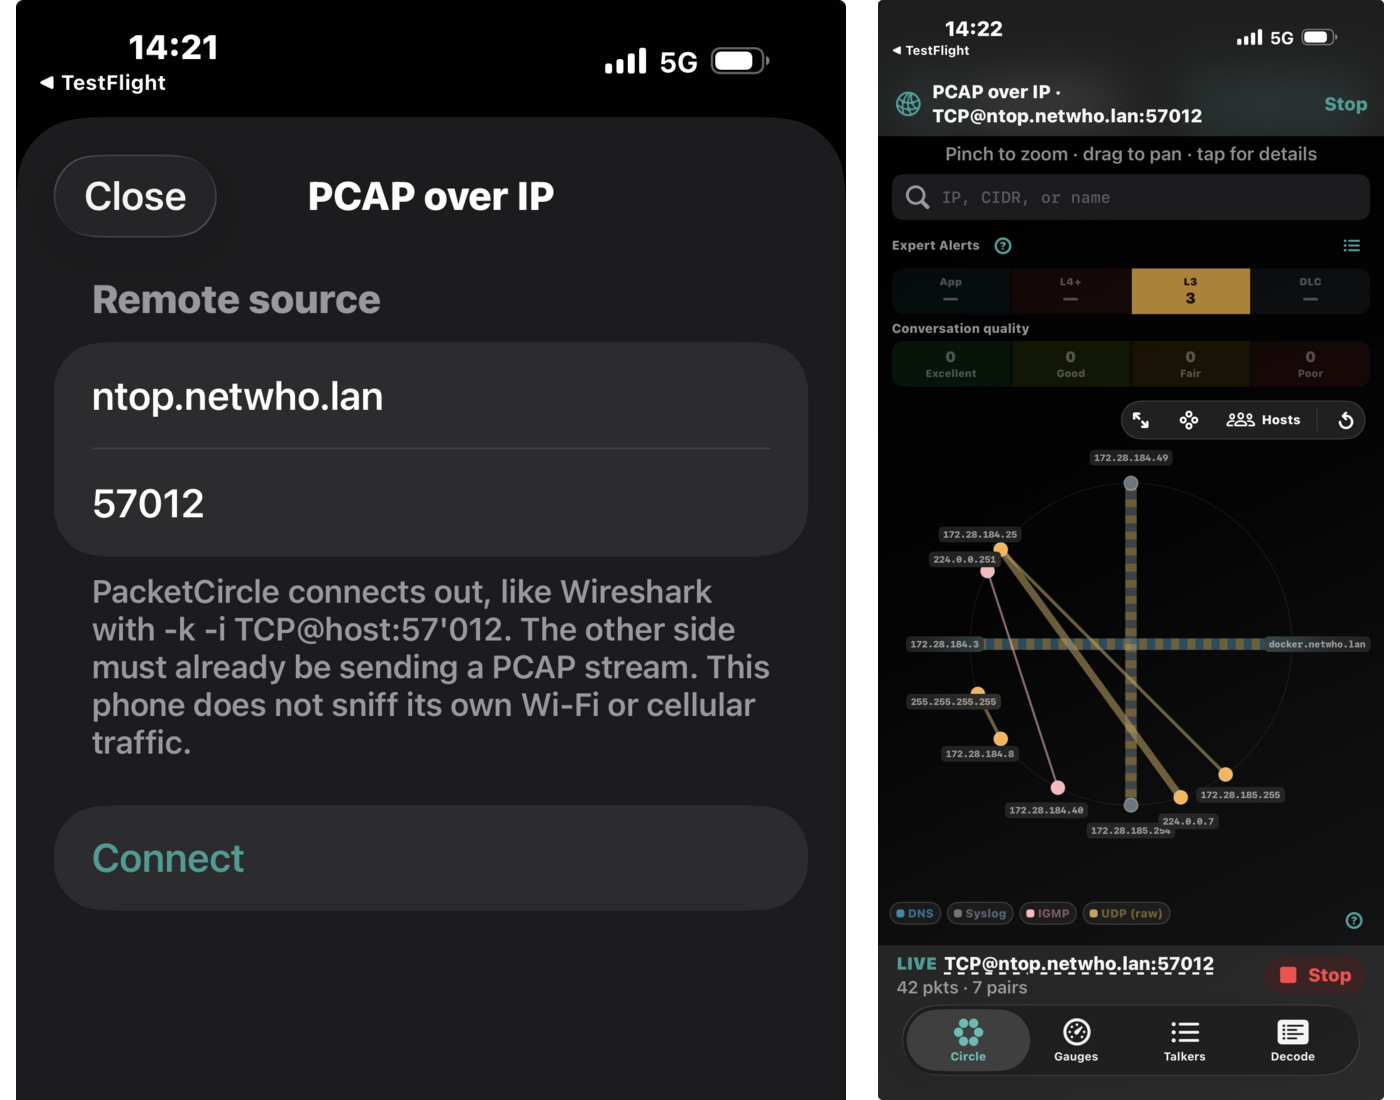
Options → PCAP over IP opens the connect sheet once Options is dismissed. Nothing is captured until PacketCircle connects; the sensor streams only what crosses the interface you point it at.
3.8 Sanitize Capture & Generate Report (1.2.5)
Tap the file name above the tab bar → Capture details, or Options → Capture tools, for:
| Tool | What it does |
|---|---|
| Sanitize Capture… | Native streaming scrub — sanitize all payload, only clear-text payload, or payload + IP/MAC anonymization — with checksum fixups. Writes a new PCAPNG; the original file is never modified. The same modes as the PacketSanitizerPro Wireshark plugin, on device. |
| Generate Report… | Native PDF report (file summary, charts, port/TCP analysis) using the same pipeline as the Mac app and PacketReporterPro. |
3.9 Options
| Setting | Purpose |
|---|---|
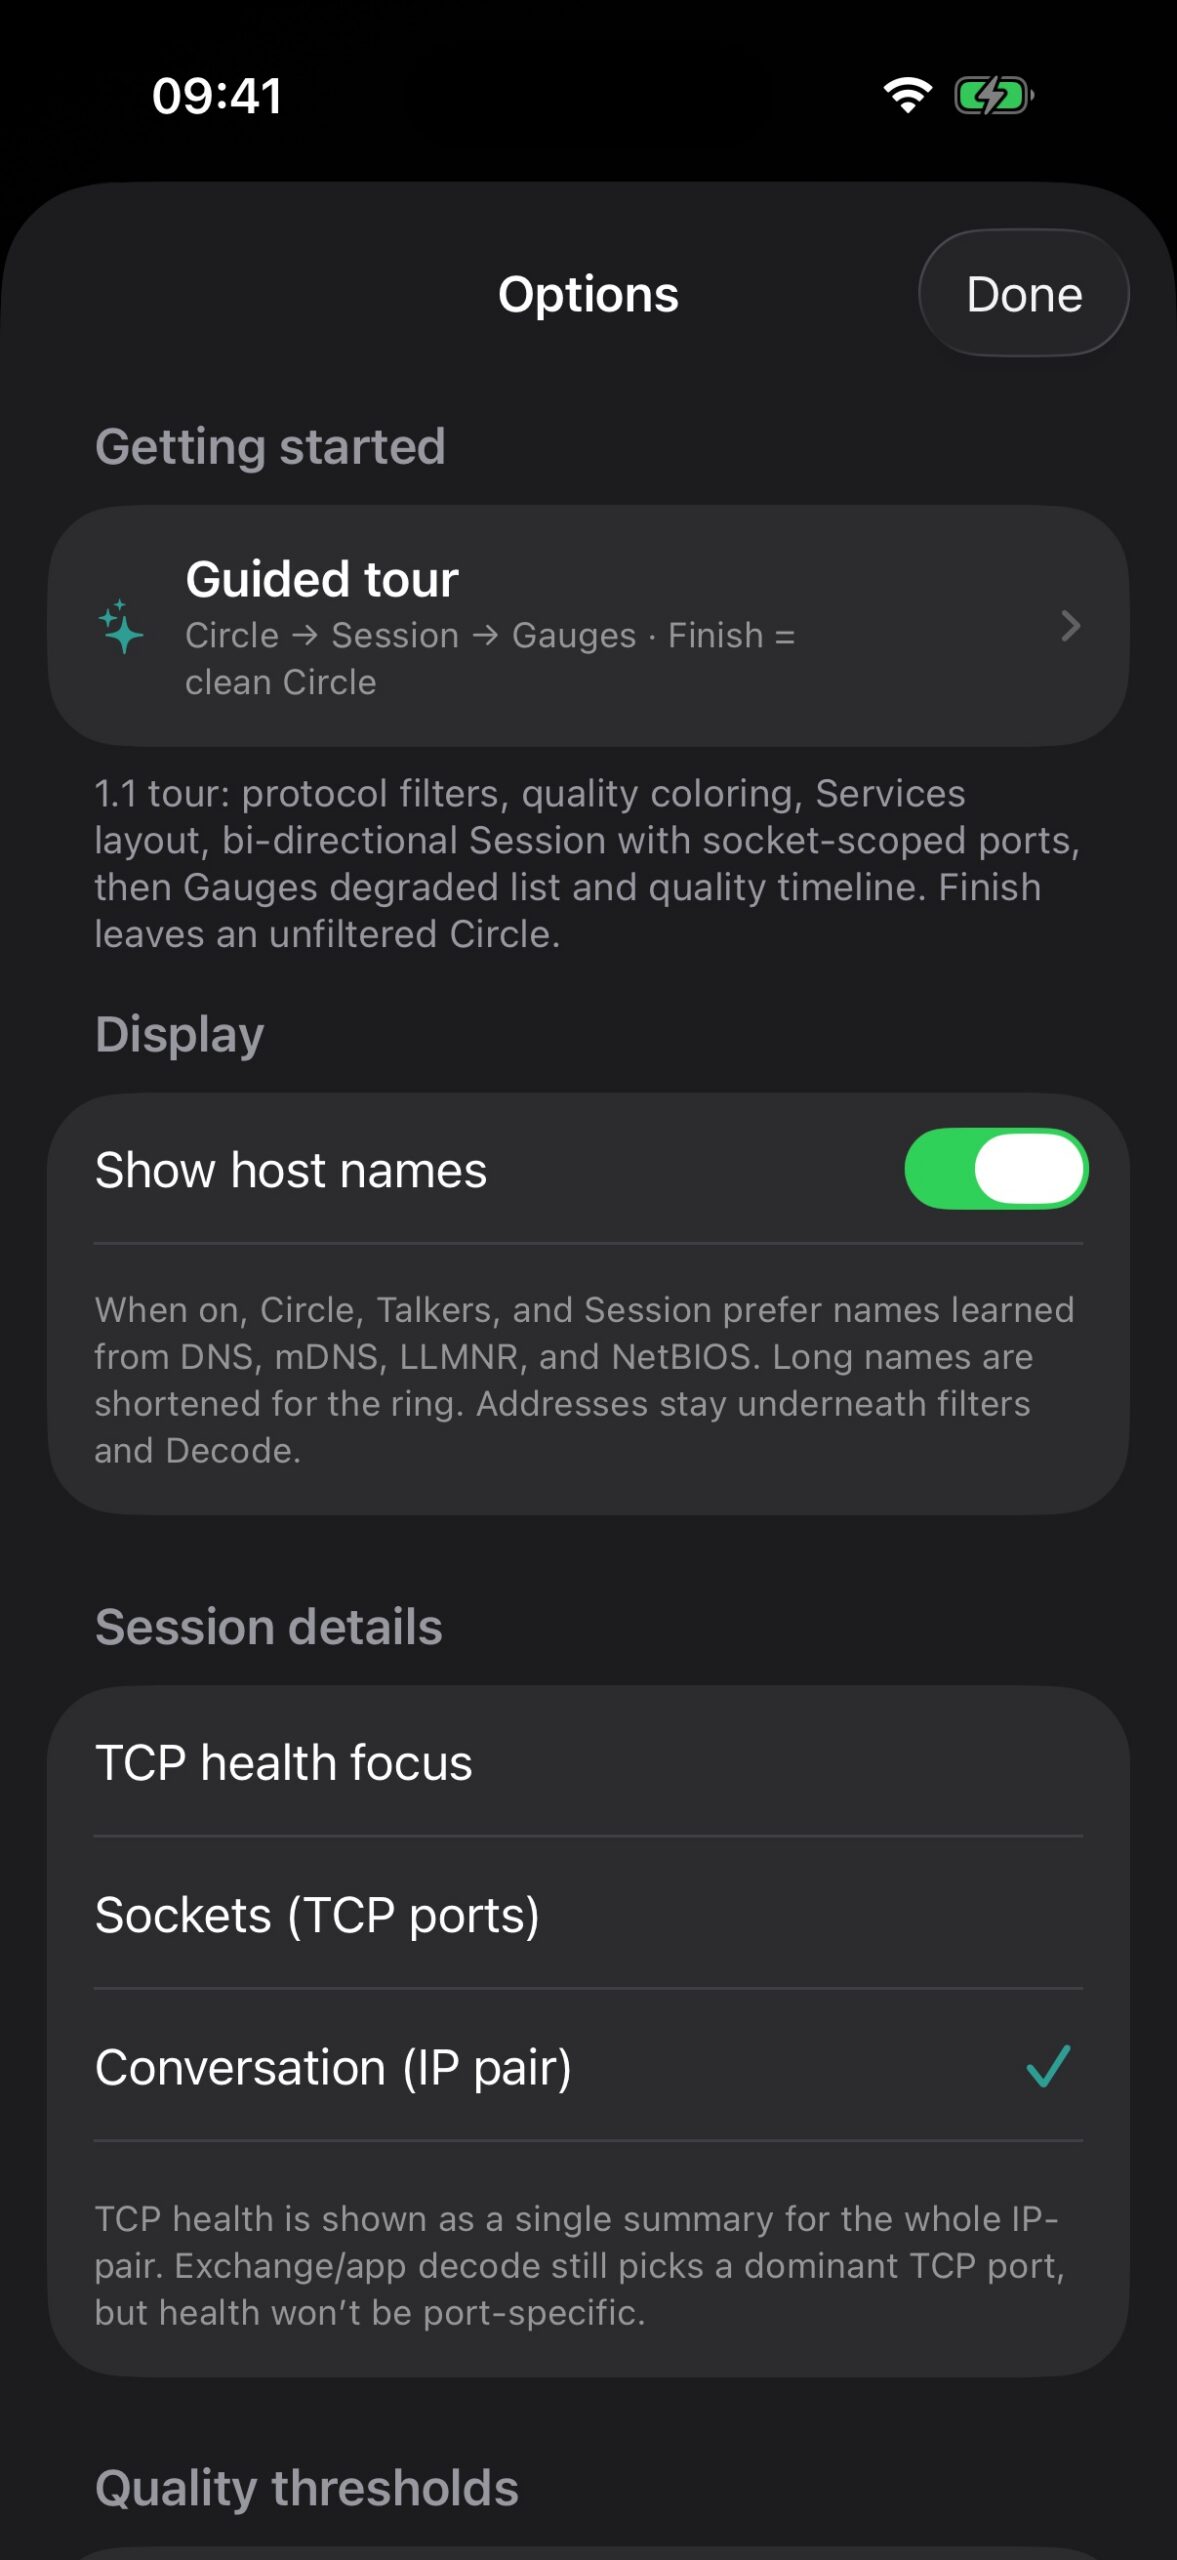
| Guided tour | Replay demo and coach-marks Circle → Session → Follow / Decode |
| TCP health focus | Sockets (TCP ports) vs Conversation (IP pair) |
| Quality thresholds | Lenient / Balanced (default) / Strict |
| Show host names | On by default (1.2.5+) — shortened DNS / mDNS / NetBIOS names on Circle, Talkers, Session |
| Follow TCP Stream budget | 64–1024 KB reassembly |
| Decode list | 500–10,000 frames |
| Circle | Show/hide the Expert Alerts strip, the conversation quality bar, and the Map layout; Known networks (names for the Networks layout) |
| Appearance (1.3.8) | Dark, Light, or follow the device |
| Capture tools | Sanitize Capture… and Generate Report… (need an open file) |
4. Workflows
A. First look at a capture
Open the file, a PCAP over IP stream, or the demo. On Circle, skim arcs and the protocol legend. Switch to quality coloring; tap Poor / Fair to solo problem edges. Open Talkers for ranked volume, or tap an edge for Session.
B. Diagnose a bad TCP session
Quality mode → filter Poor (or find the pair on Talkers). Open Session → read health (retransmits, RST, zero-window, RTT). If multiple ports: pick the socket, then check the Other sockets list for related findings. Follow TCP Stream or Decode for payload/context.
C. Expert triage
Watch the Expert Alerts strip (App / L4+ / L3 / DLC) on Circle. Tap a band to filter, or touch-and-hold for the alert list. Read the Expert panel on Session for that socket; open Decode for tree + Expert Info.
D. Remote / live triage over PCAP over IP
Point a sensor at pcapoverip or PolarProxy, then Options → PCAP over IP → connect. Traffic streams onto the Circle as it arrives — same workflow as a loaded file once connected.
E. Share a capture safely
Capture details → Sanitize Capture… — choose a scrub mode, save the PCAPNG, hand it off. Generate Report… for a PDF summary instead of (or alongside) the raw file.
5. Built-in demo capture
PacketCircleDemo.pcap ships with the app for the Guided tour and offline exploration: mixed cleartext lab traffic (HTTP, FTP, SSH, Telnet, DNS, SMB…), corporate-LAN stories that exercise App / L3 / DLC experts, isolated Excellent / Good / Fair / Poor quality examples, and a receive-window lab for the quality charts.
6. Related documentation
| macOS User Manual | The desktop half of PacketCircle Native |
| Updates & Blogs | Release notes for every PacketCircle version |
| PCAP over IP explainer | How the remote-capture broker works, and where to get one |
| PacketCircle for iPhone | The original App Store launch write-up |
| App Store listing | Install PacketCircle on iPhone / iPad |