PacketCircle iOS — User Manual
The iPhone/iPad half of PacketCircle Native: conversation topology, native TCP health, remote live capture over PCAP over IP, on-device Sanitize and PDF Report — built in Swift/SwiftUI.
1. Background and motivation
PacketCircle started as ideas from the open-source Wireshark plugin that drew host-to-host conversations as a circle. The native Apple apps (macOS and iOS) take that visualization further: open a PCAP/PCAPNG — or pull a live stream from a remote sensor — see who talks to whom, spot rough TCP health, and drill into a conversation, without shipping Wireshark or a GPL dissection stack inside the product.
What it is
A capture visualizer focused on conversation topology, talkers, native TCP session-quality estimates, and lightweight decode. As of 1.2.5: the same Expert Alerts findings on Circle, Session, and Decode as the Mac app, plus native Sanitize Capture, Generate Report, and an Infrastructure Map Circle layout (Hosts → Services → Map). Decode has a Wireshark-style display filter (PacketCircle fields only) beside text/hex search. Opens PCAP, PCAPNG, gzip (.pcap.gz / .pcapng.gz), and Sniffer Pro .cap / .caz (Ethernet). Proprietary — not open source. Free to use, and it collects no data at all.
What it is not
PacketCircle is not a mobile Wireshark. It contains no open-source Wireshark / libwireshark dissection, and makes no claim of protocol parity with Wireshark’s dissectors, expert infos, or tcp.analysis fields. Application-layer decode is best-effort and limited: reasonable IP and TCP trees, hex, and some app-level recognition (HTTP request lines, DNS names, SSH banners, FTP/Telnet ASCII, SMB headers, TLS SNI where detectable, NetBIOS/Windows Browser). That is often enough to orient a lab or field capture — it is not comparable to Wireshark’s depth or accuracy. And it is not a local Wi-Fi/interface sniffer: a sandboxed App Store app cannot capture its own network traffic. PCAP over IP (below) is a live remote stream you pull in from a sensor you control — the phone never touches its own Wi-Fi or cellular traffic.
2. Getting started
| Step | Action |
|---|---|
| 1 | Install PacketCircle from the App Store. |
| 2 | On first launch, take the Guided tour, or open Options → Guided tour later. |
| 3 | Tap the folder control to import a PCAP or PCAPNG, connect to a remote sensor over PCAP over IP, or use the demo sample when the canvas is empty. |
| 4 | Explore Circle → Talkers / Session → Decode as needed. |
3. Main screens and functions
3.1 Circle
The Circle tab is the primary view: hosts on a ring, edges for conversations, color by protocol or quality.
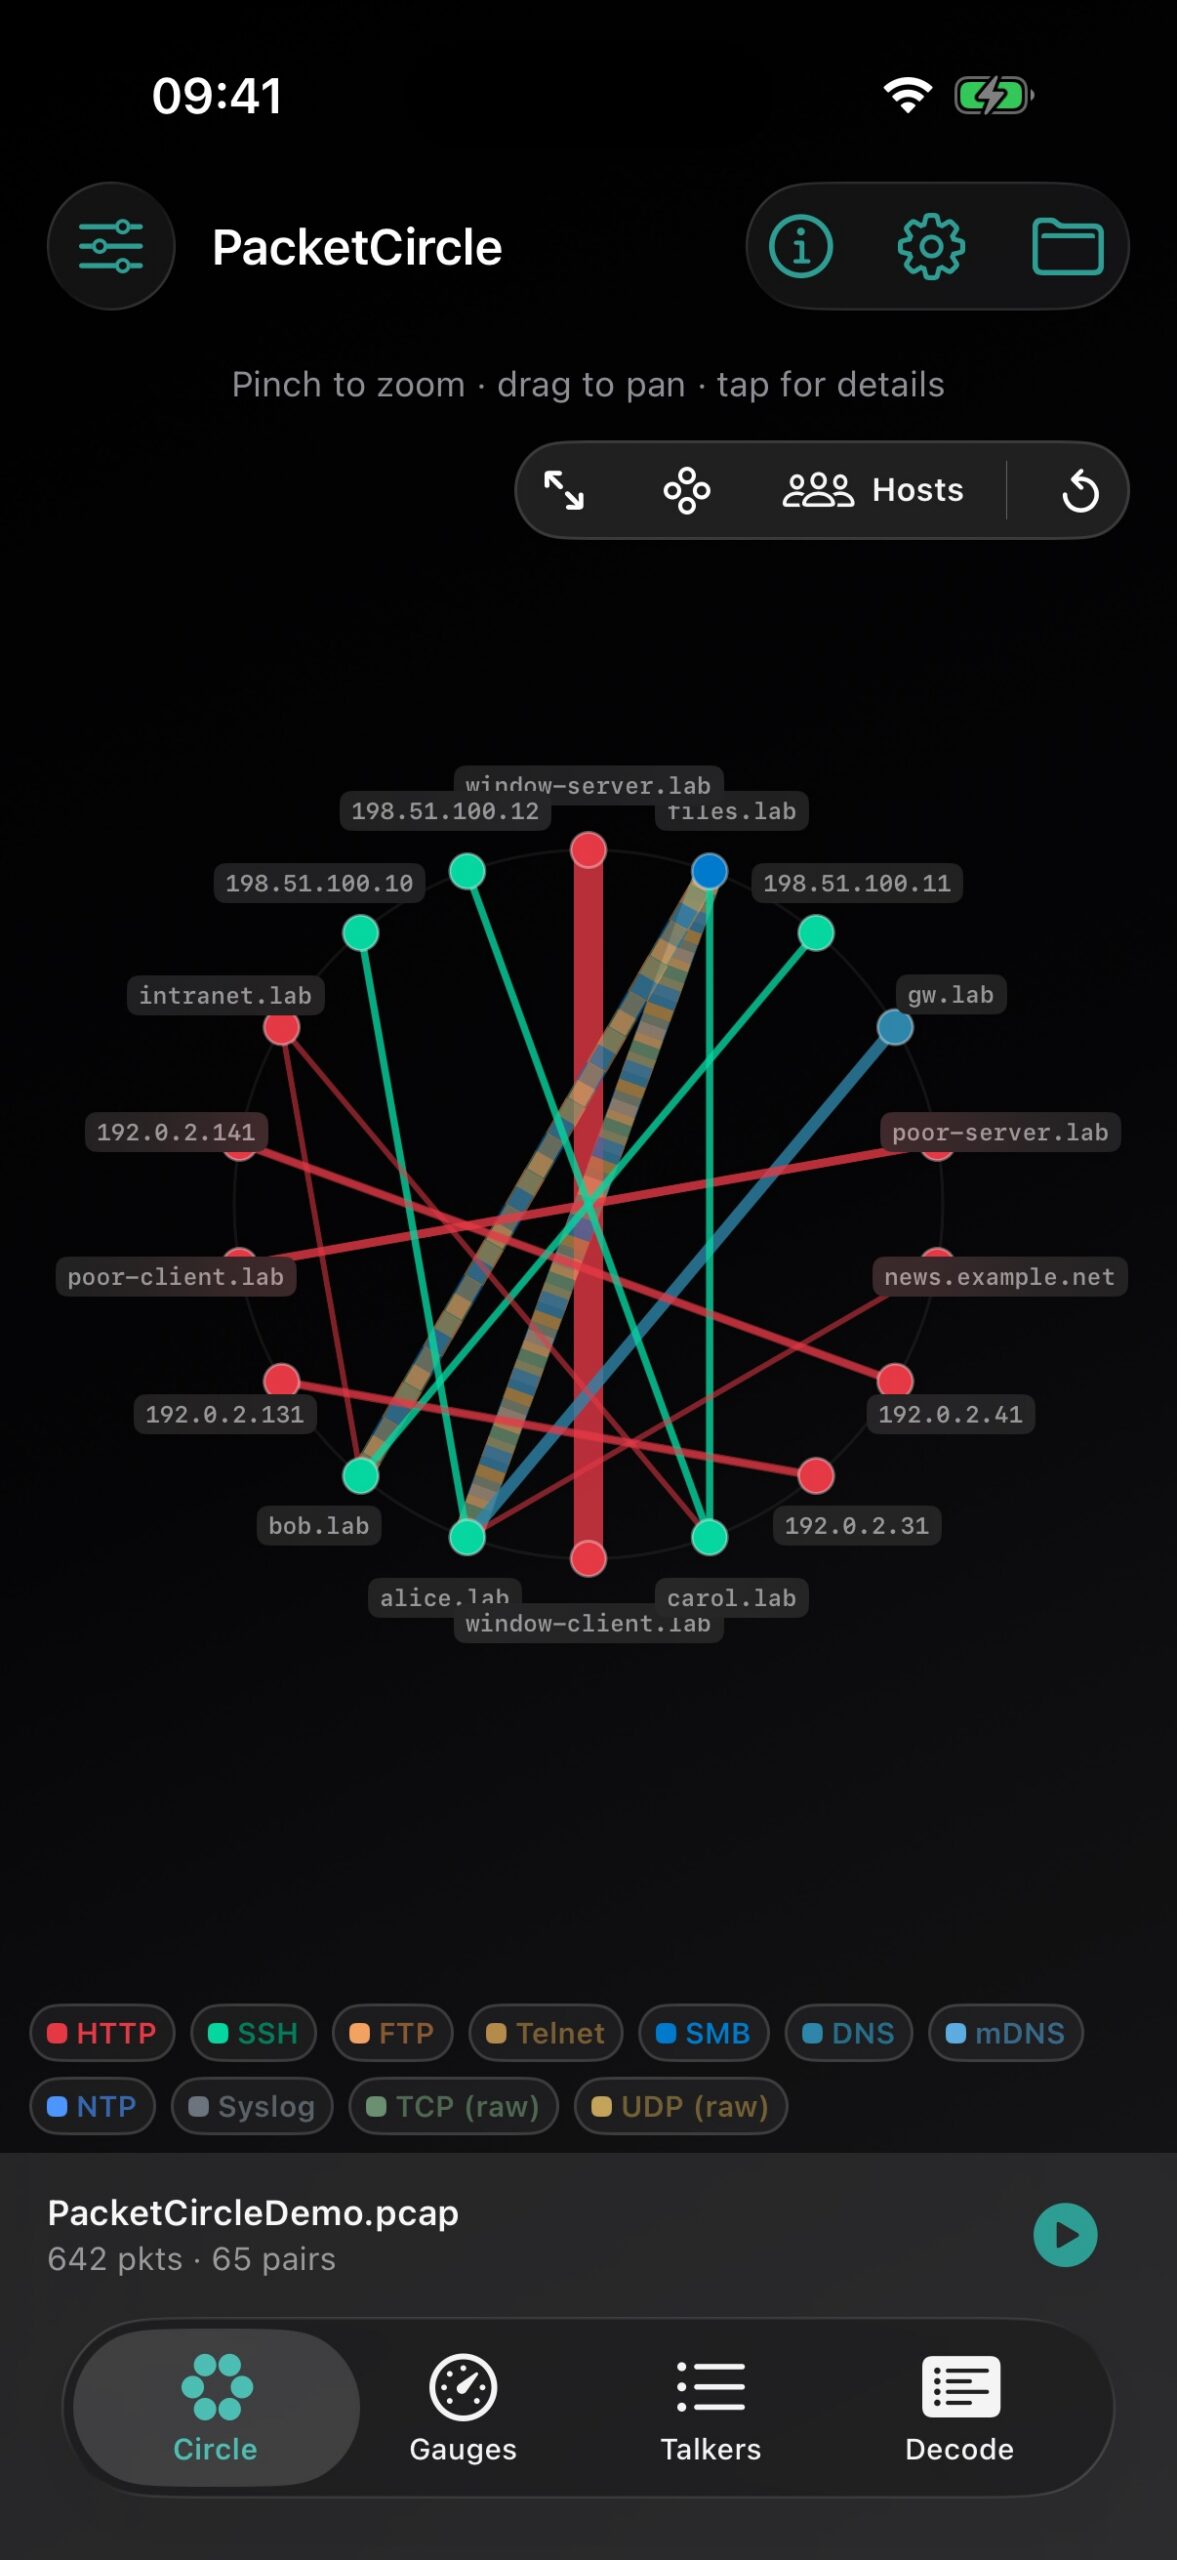
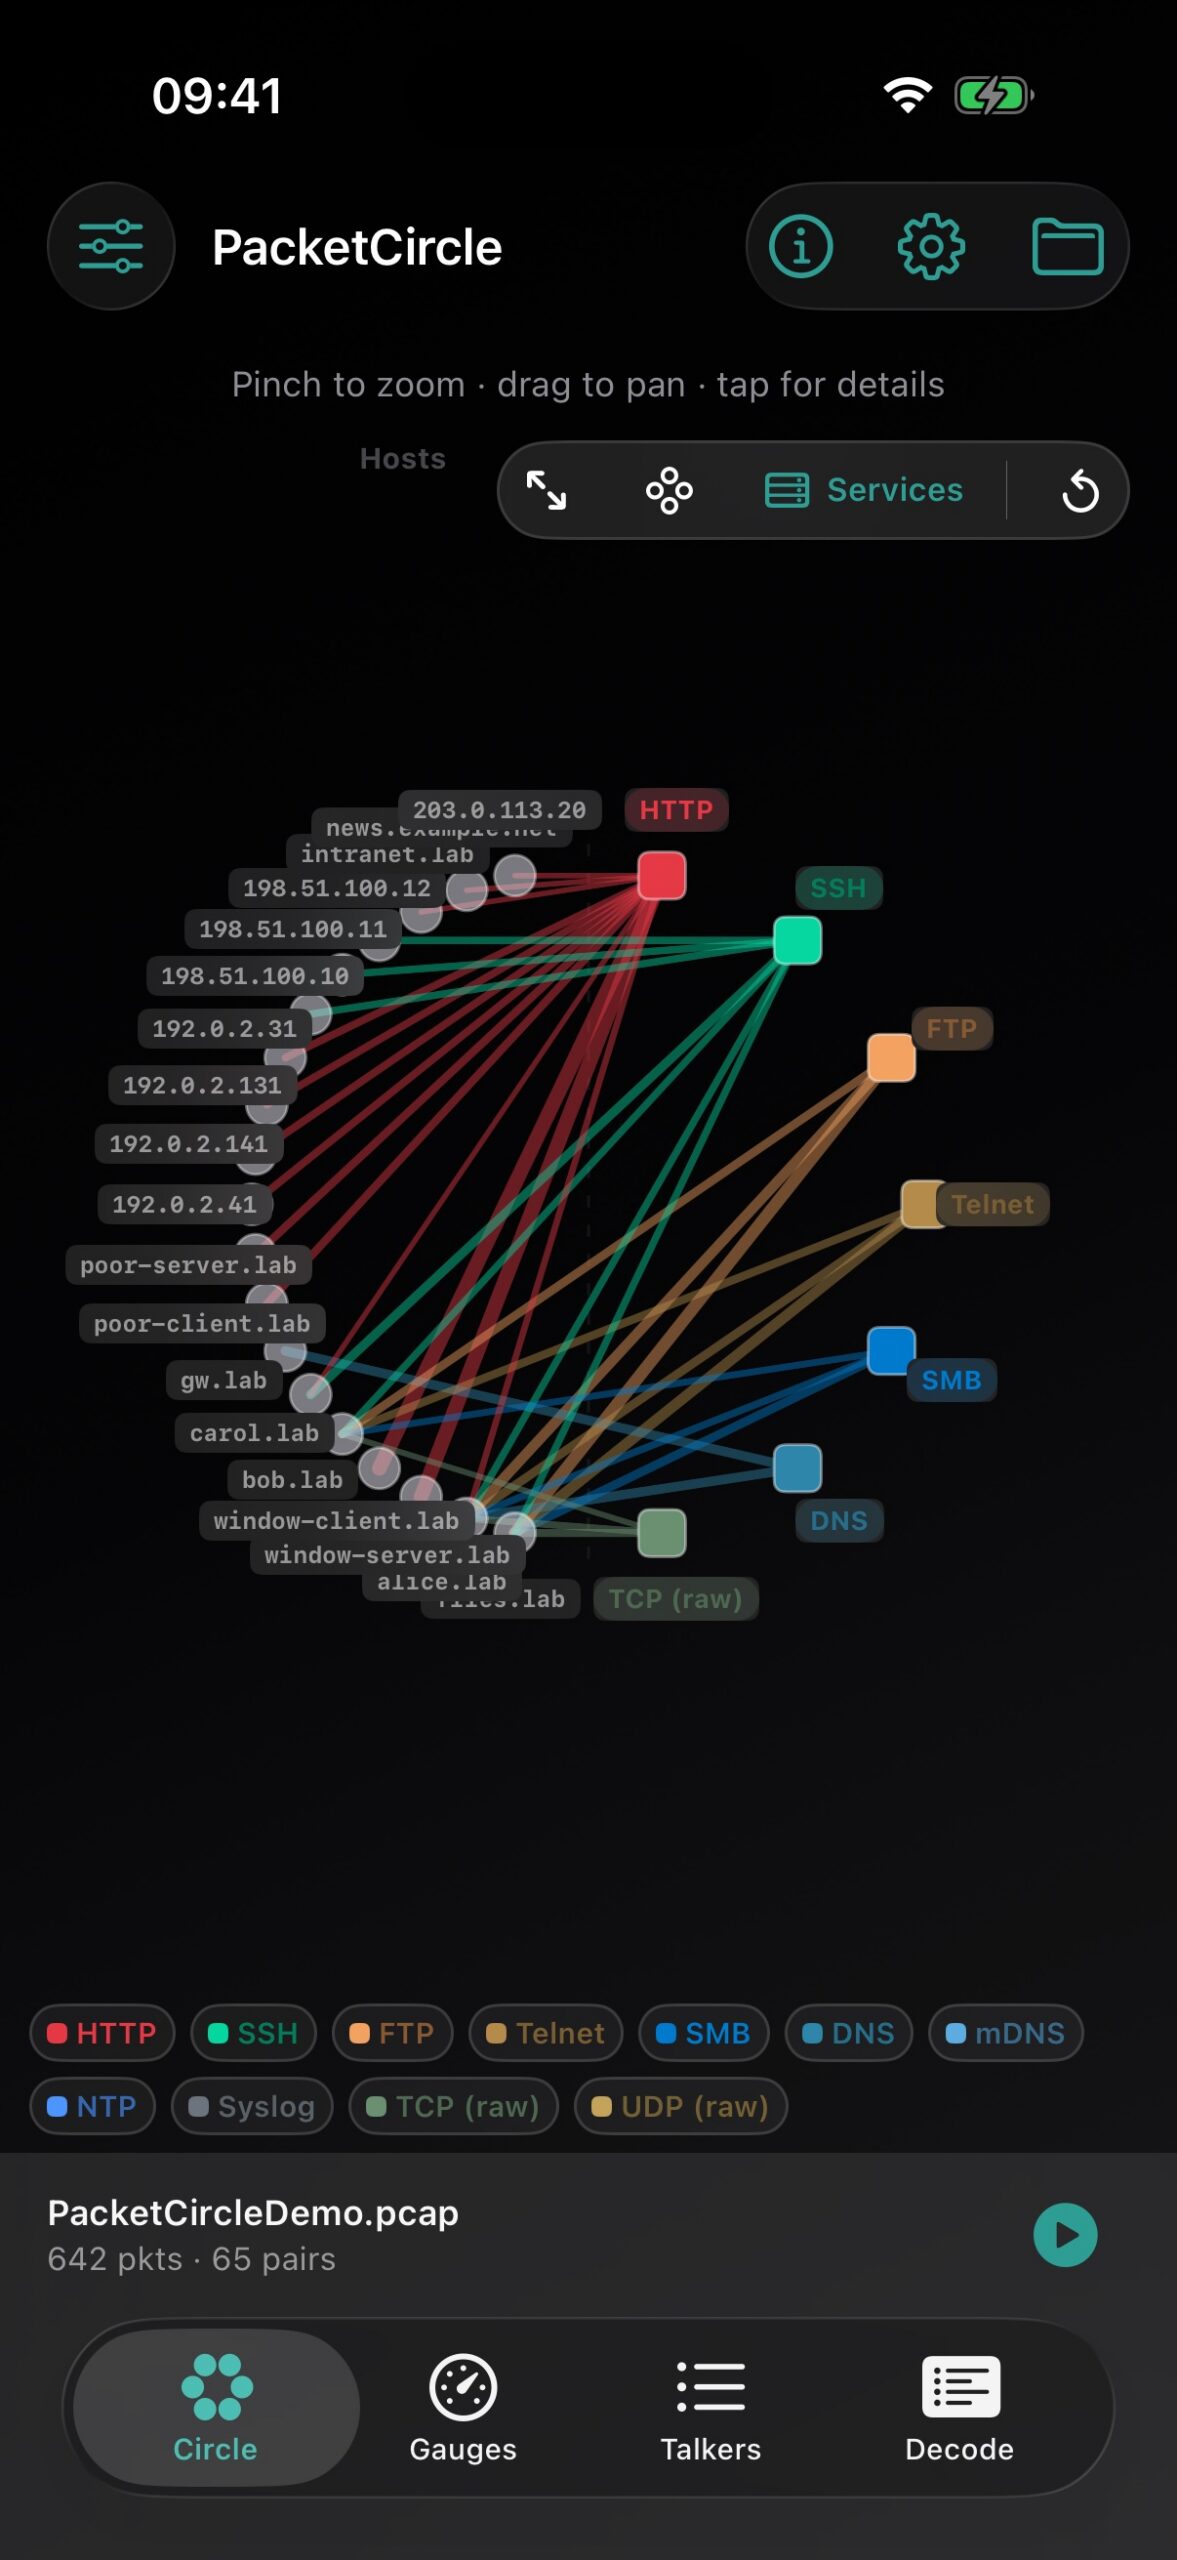
| Layout | Shows |
|---|---|
| Hosts | Host-to-host conversations around the ring |
| Services | Hosts on one side, service ports on the other |
| Map (1.2.5+) | Infrastructure Map — Core / Distribution / Access, learned from STP, CDP, LLDP, OSPF, BGP, EIGRP, IS-IS, RIP and ARP in the capture. Tap a switch or router to open its Session details. Toggle off in Options → Circle → Show Infrastructure Map. |
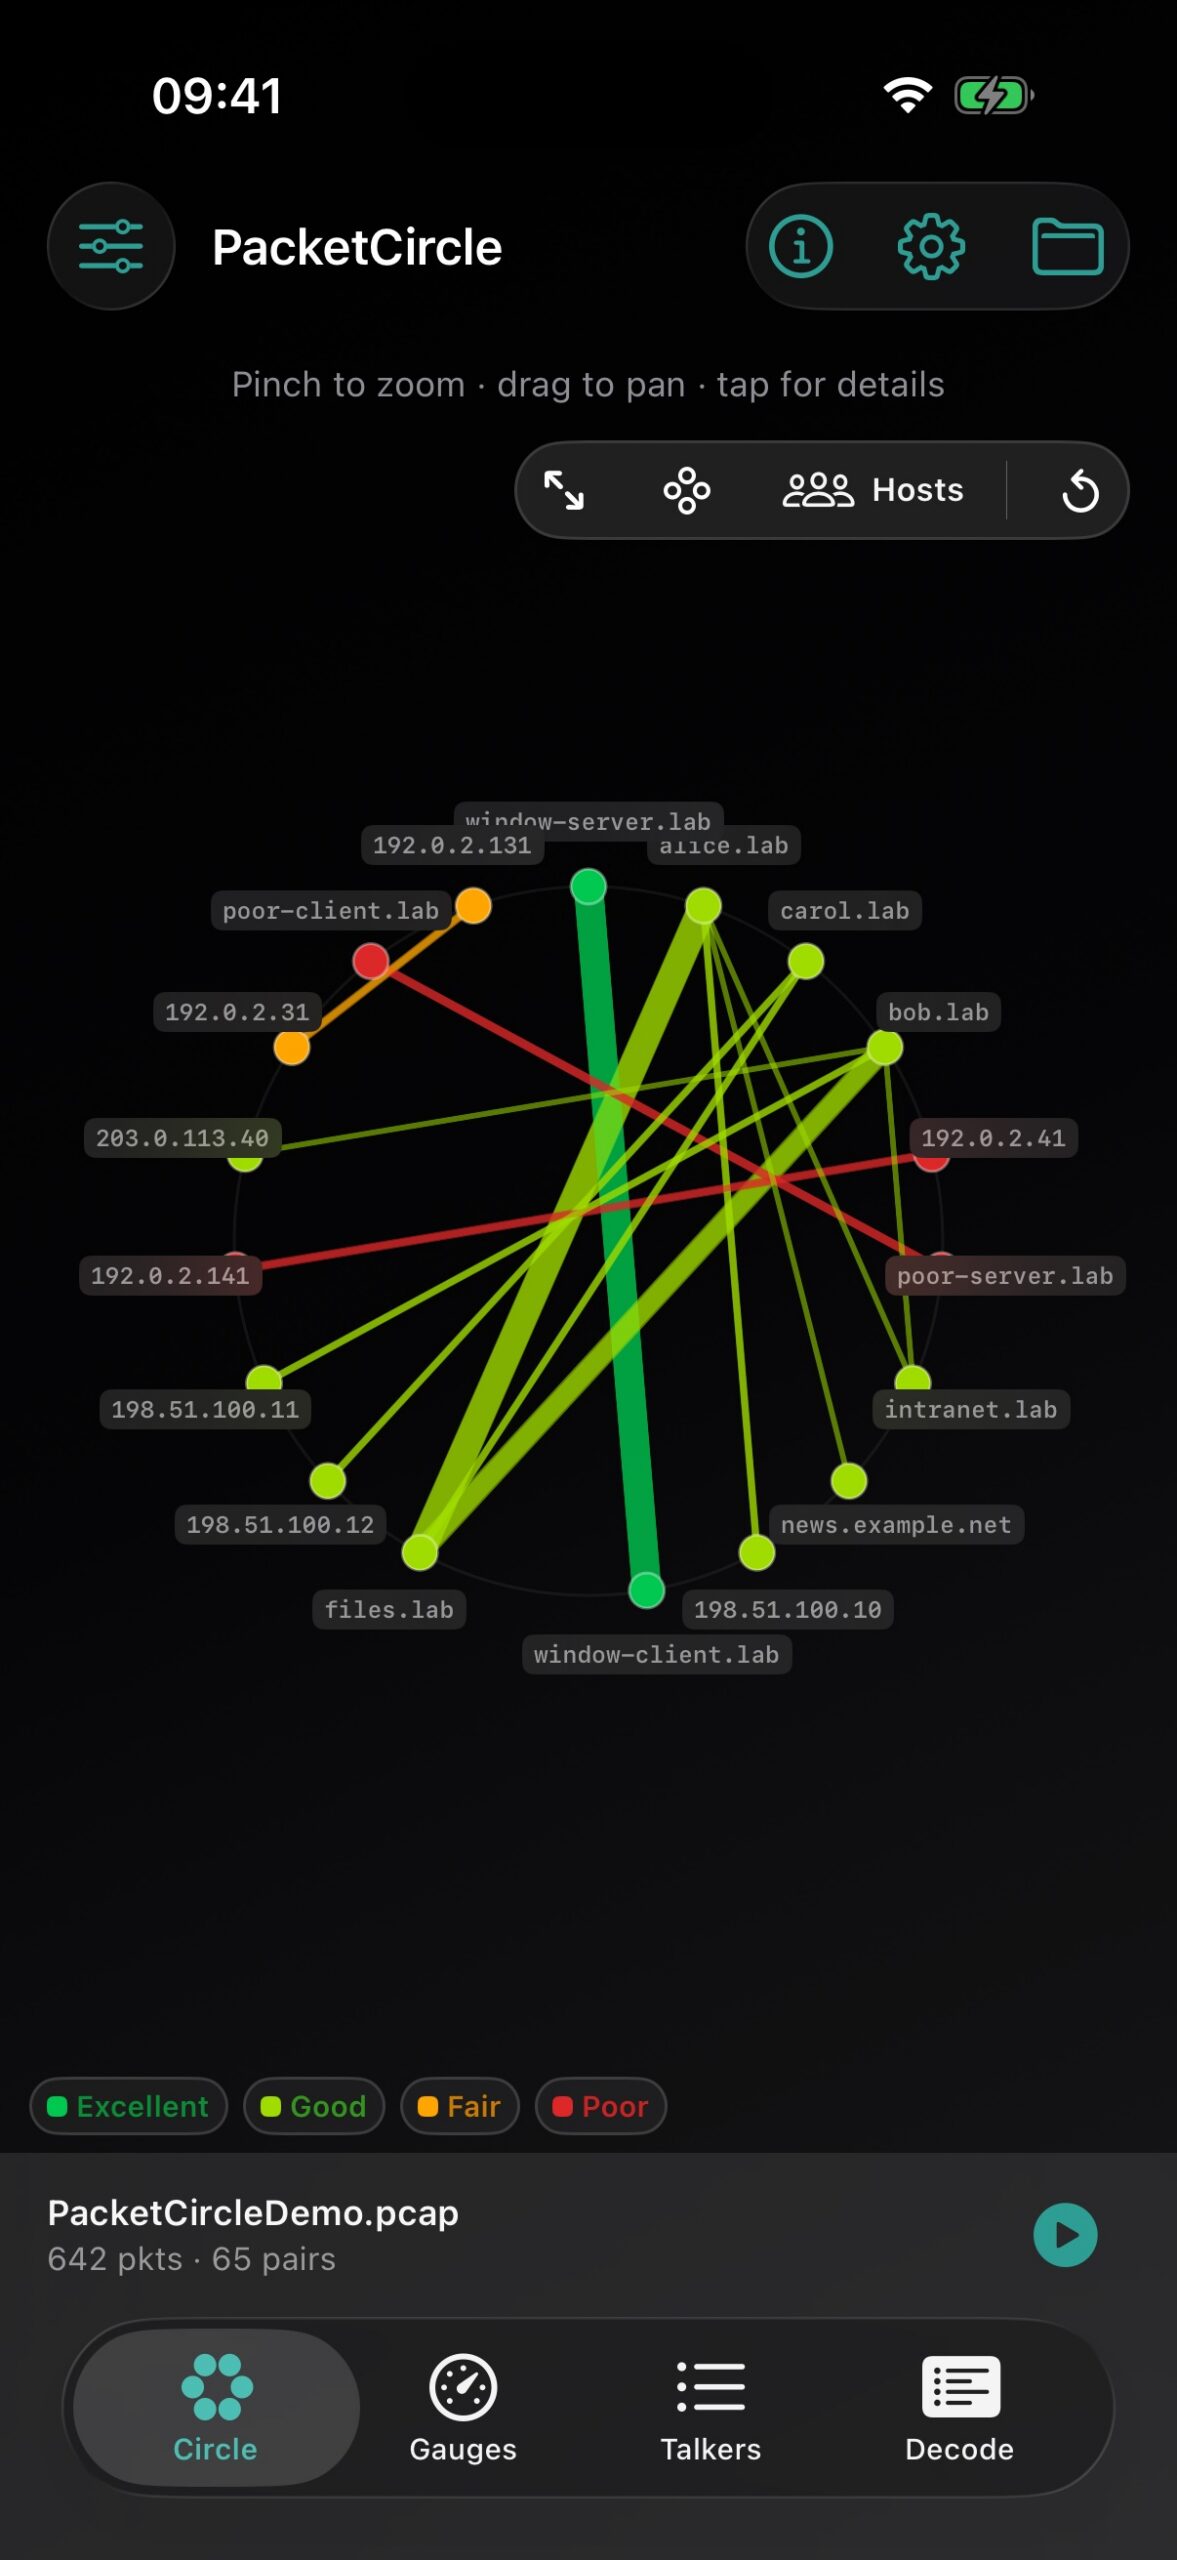
Under search: Expert Alerts (App / L4+ / L3 / DLC) then the conversation quality bar — both can be hidden in Options → Circle. Tap a band to filter; touch-and-hold a chip opens that band’s alert list.
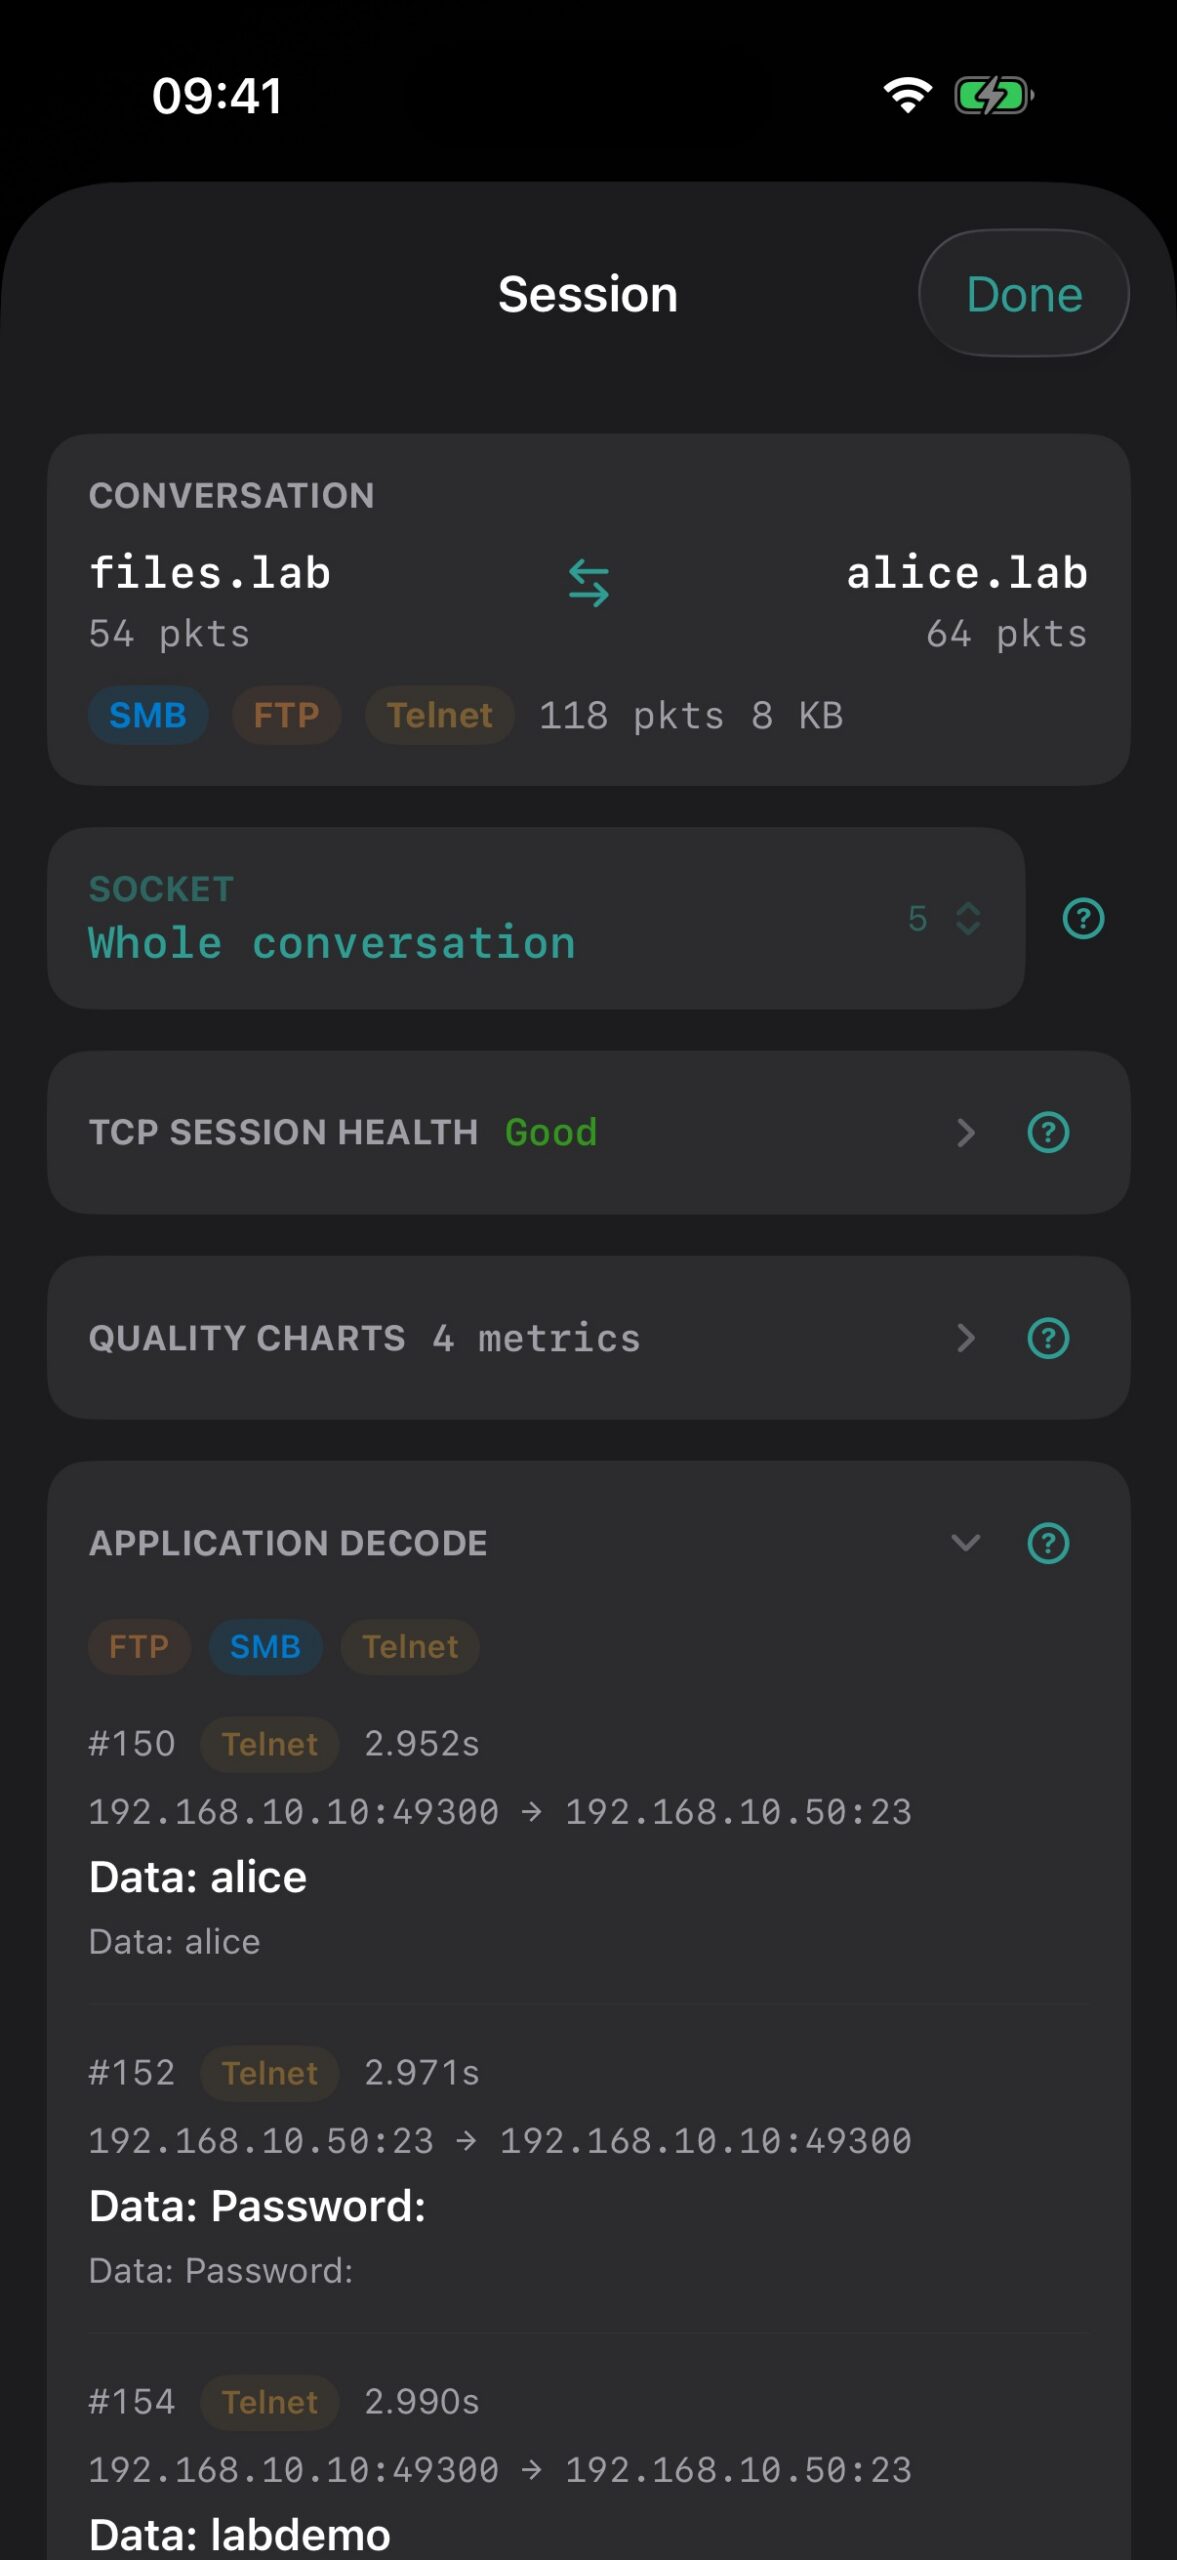
3.2 Session details
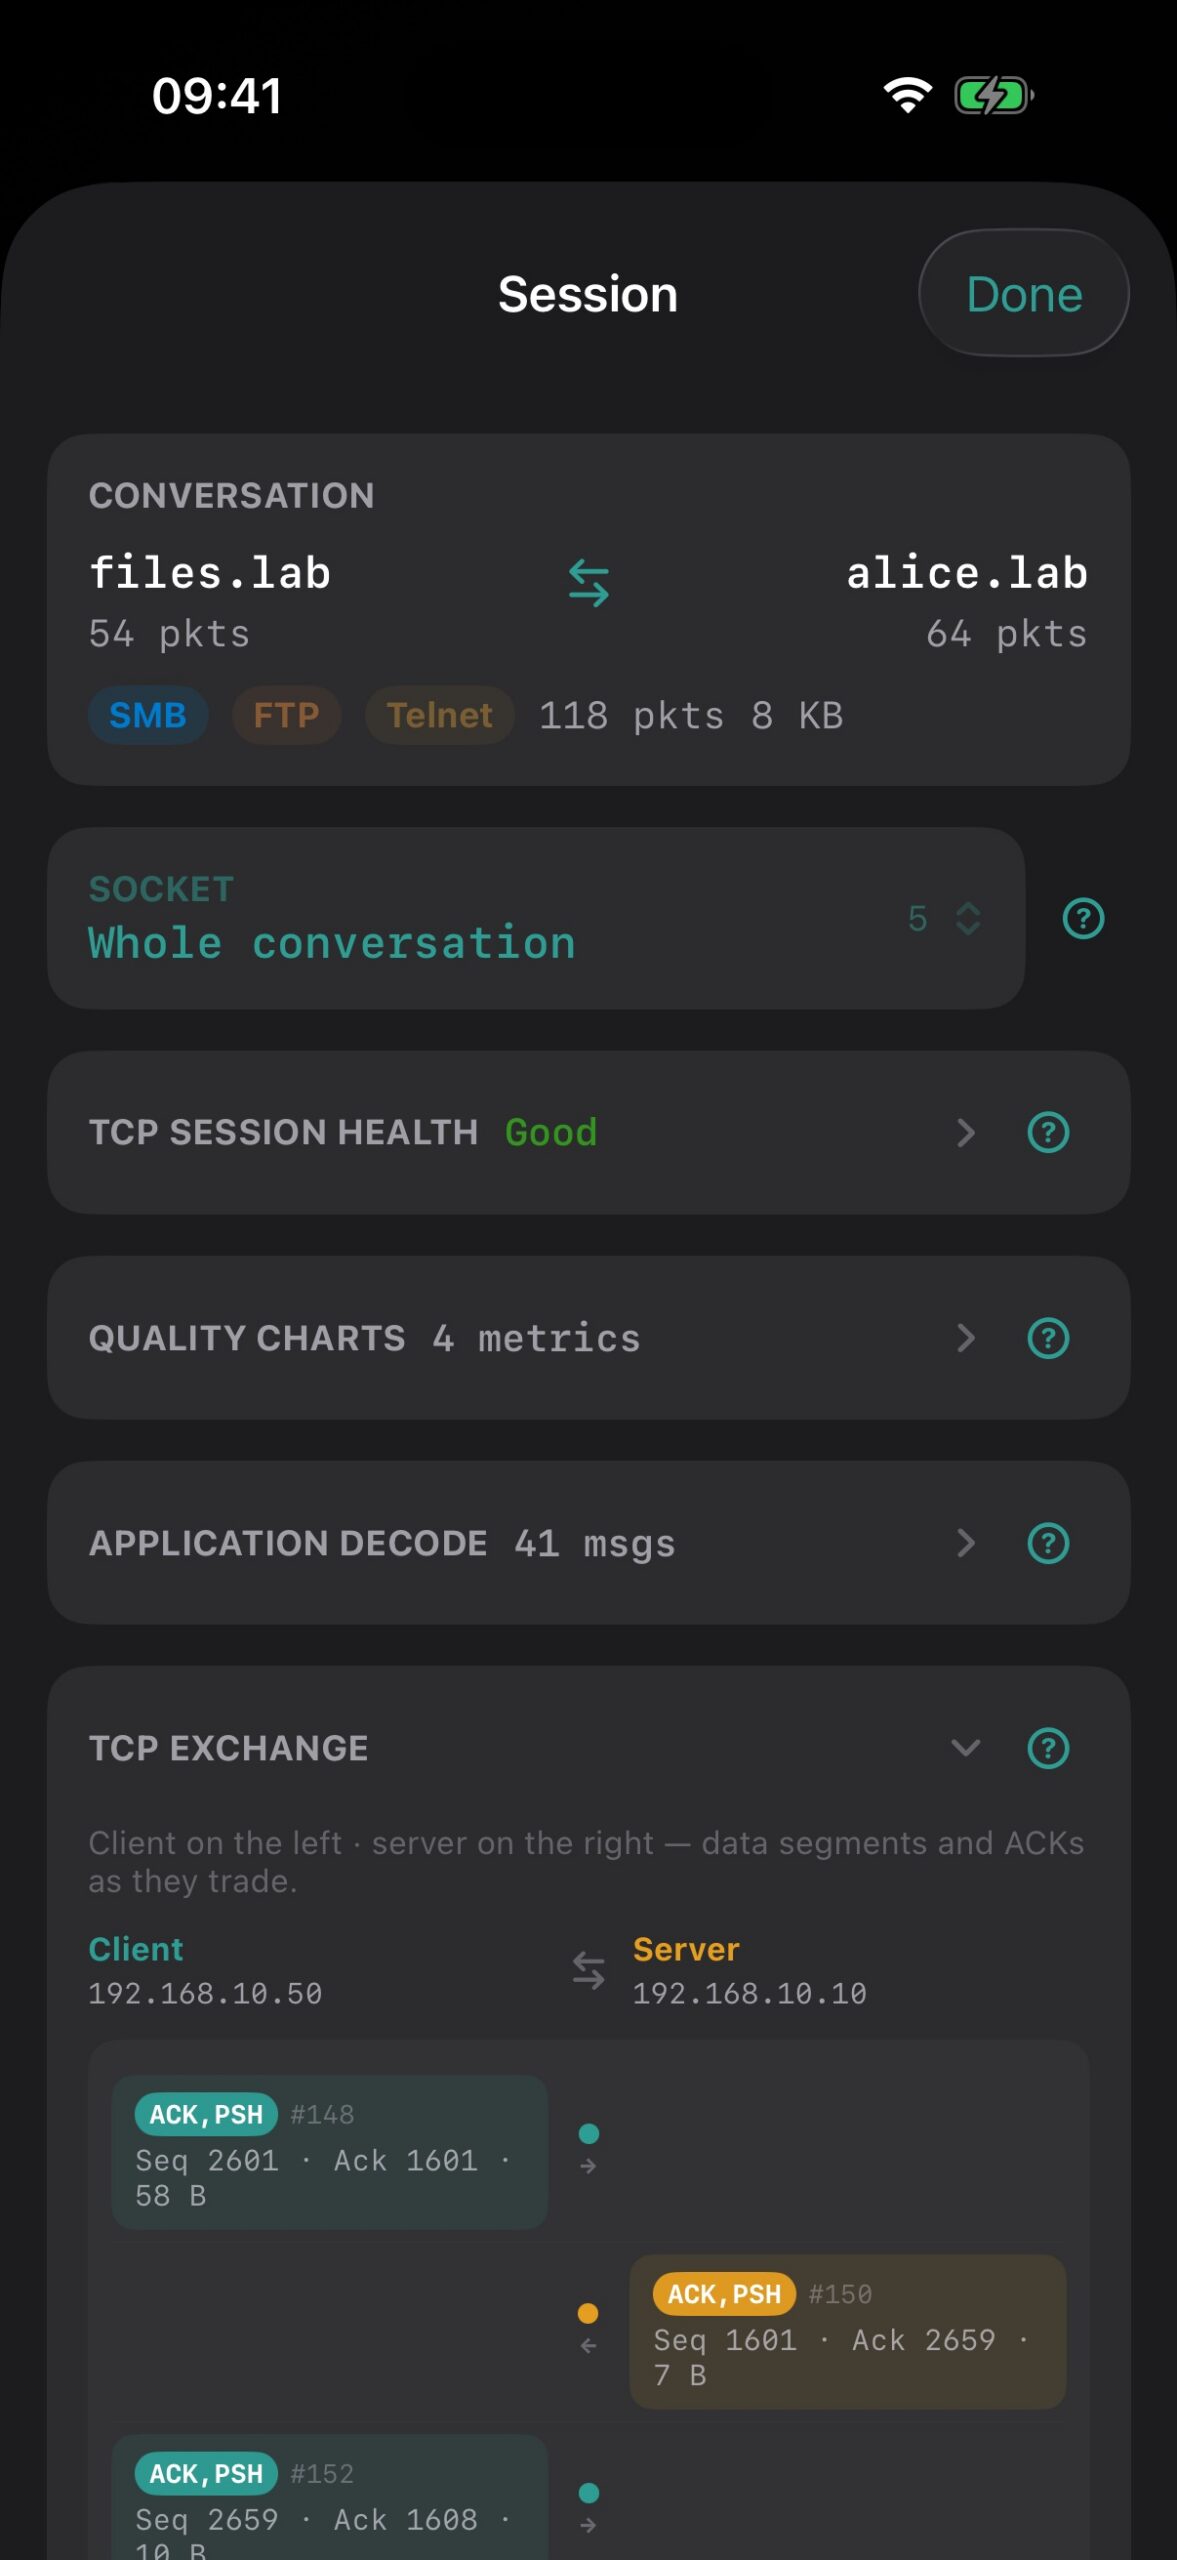
Tap a conversation to open Session: conversation summary, socket picker, Expert findings for the selected socket, TCP session health, quality charts, and actions such as Follow TCP Stream.
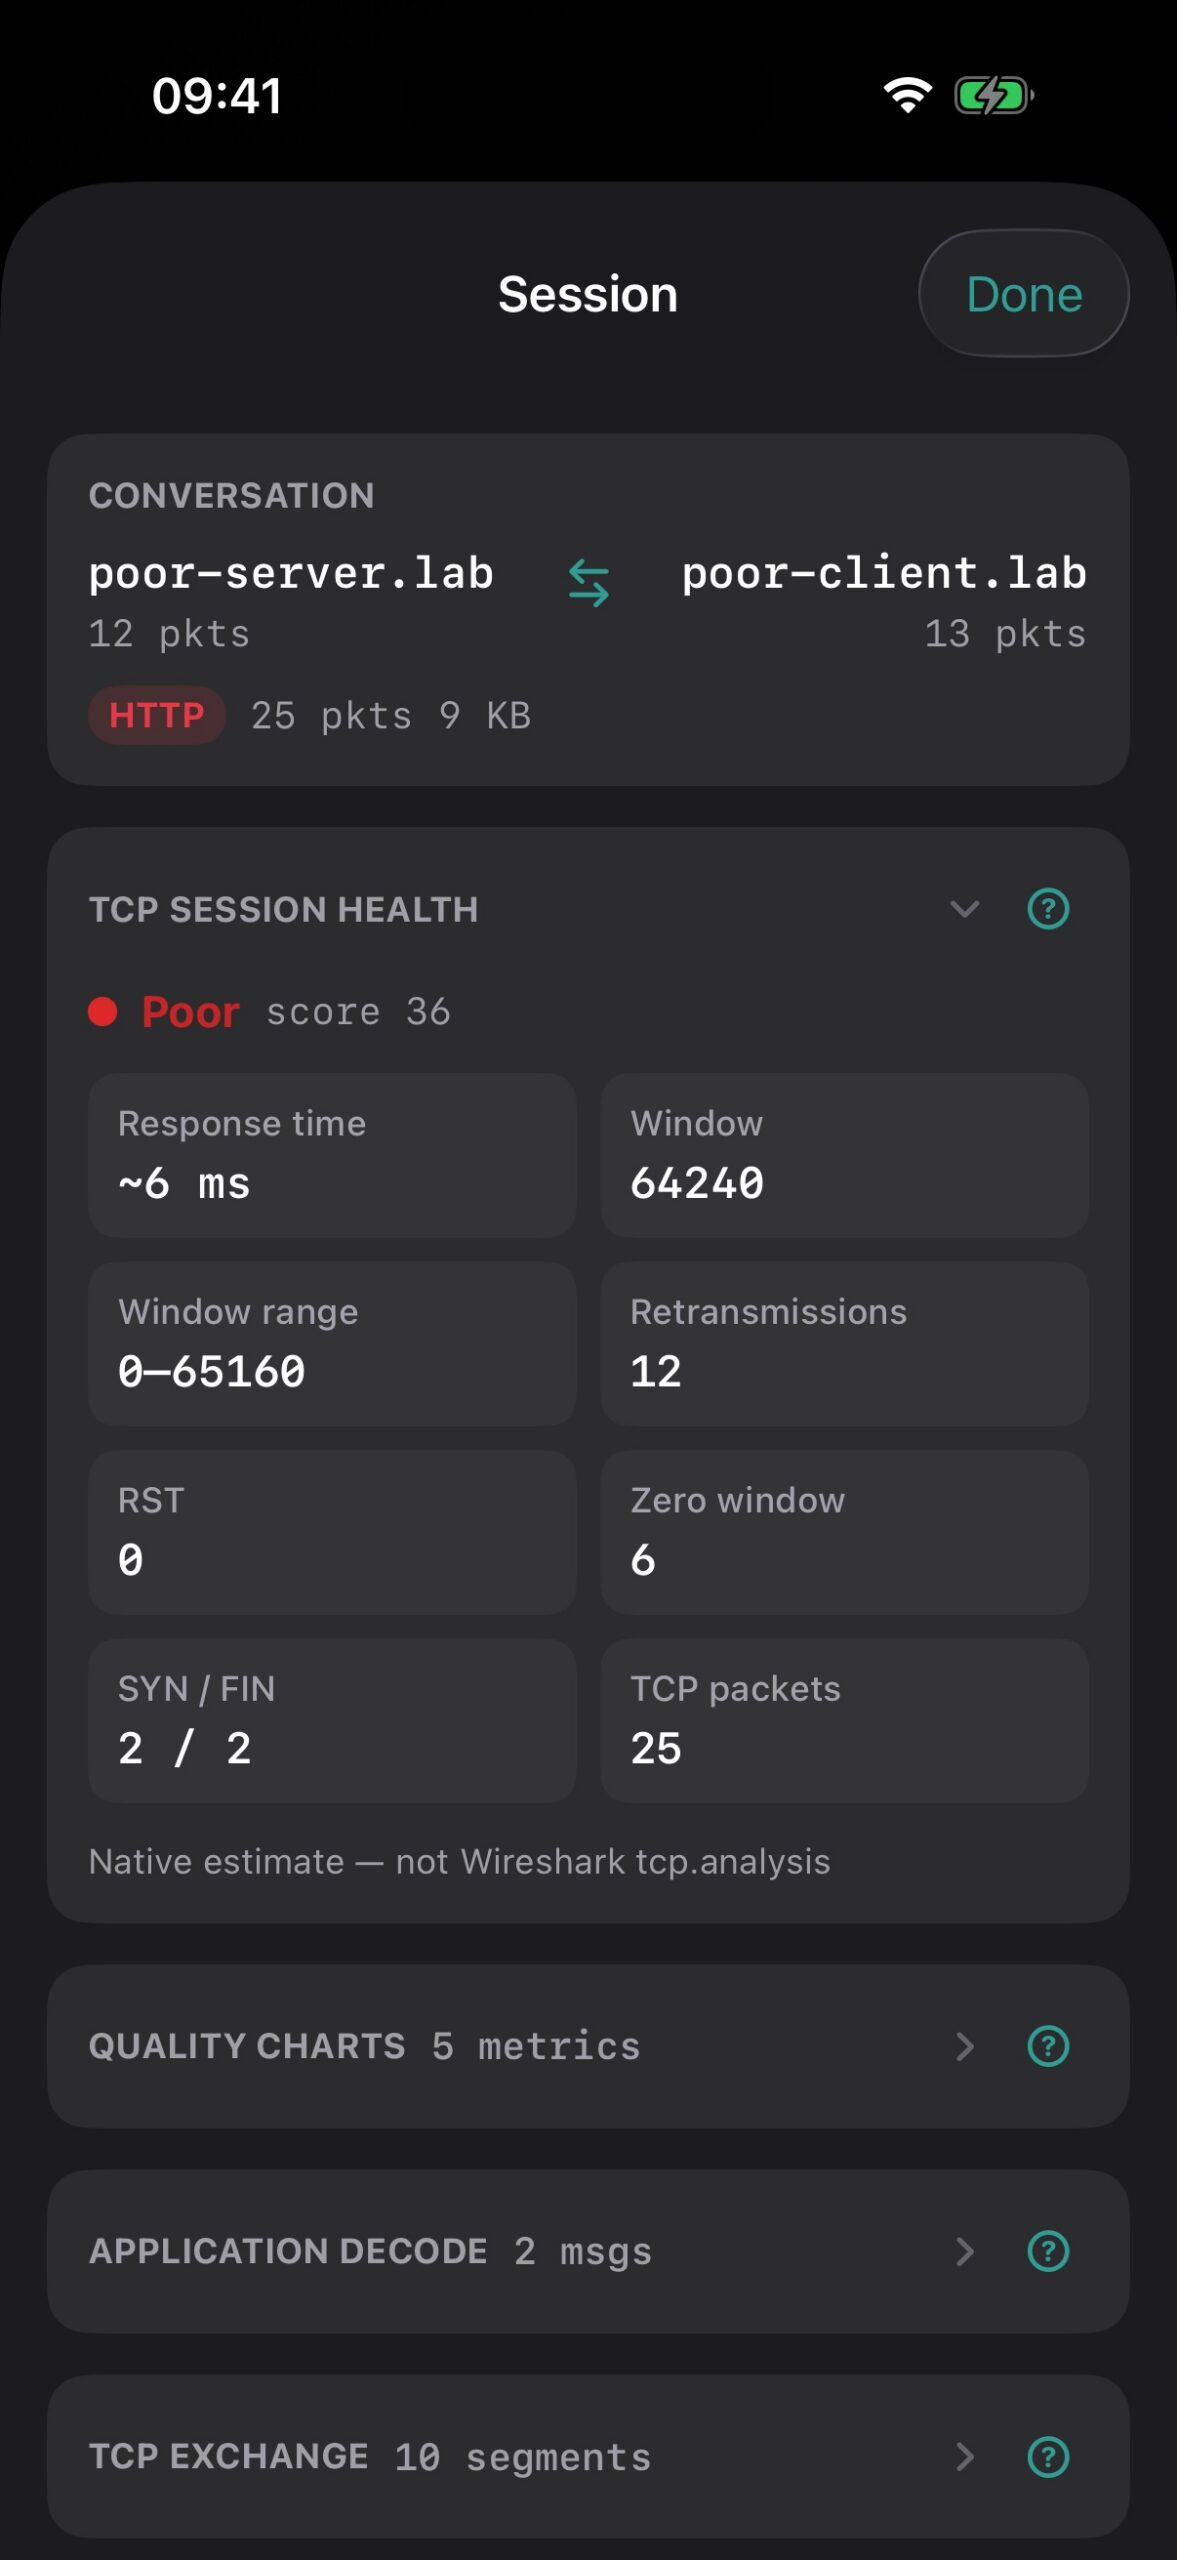
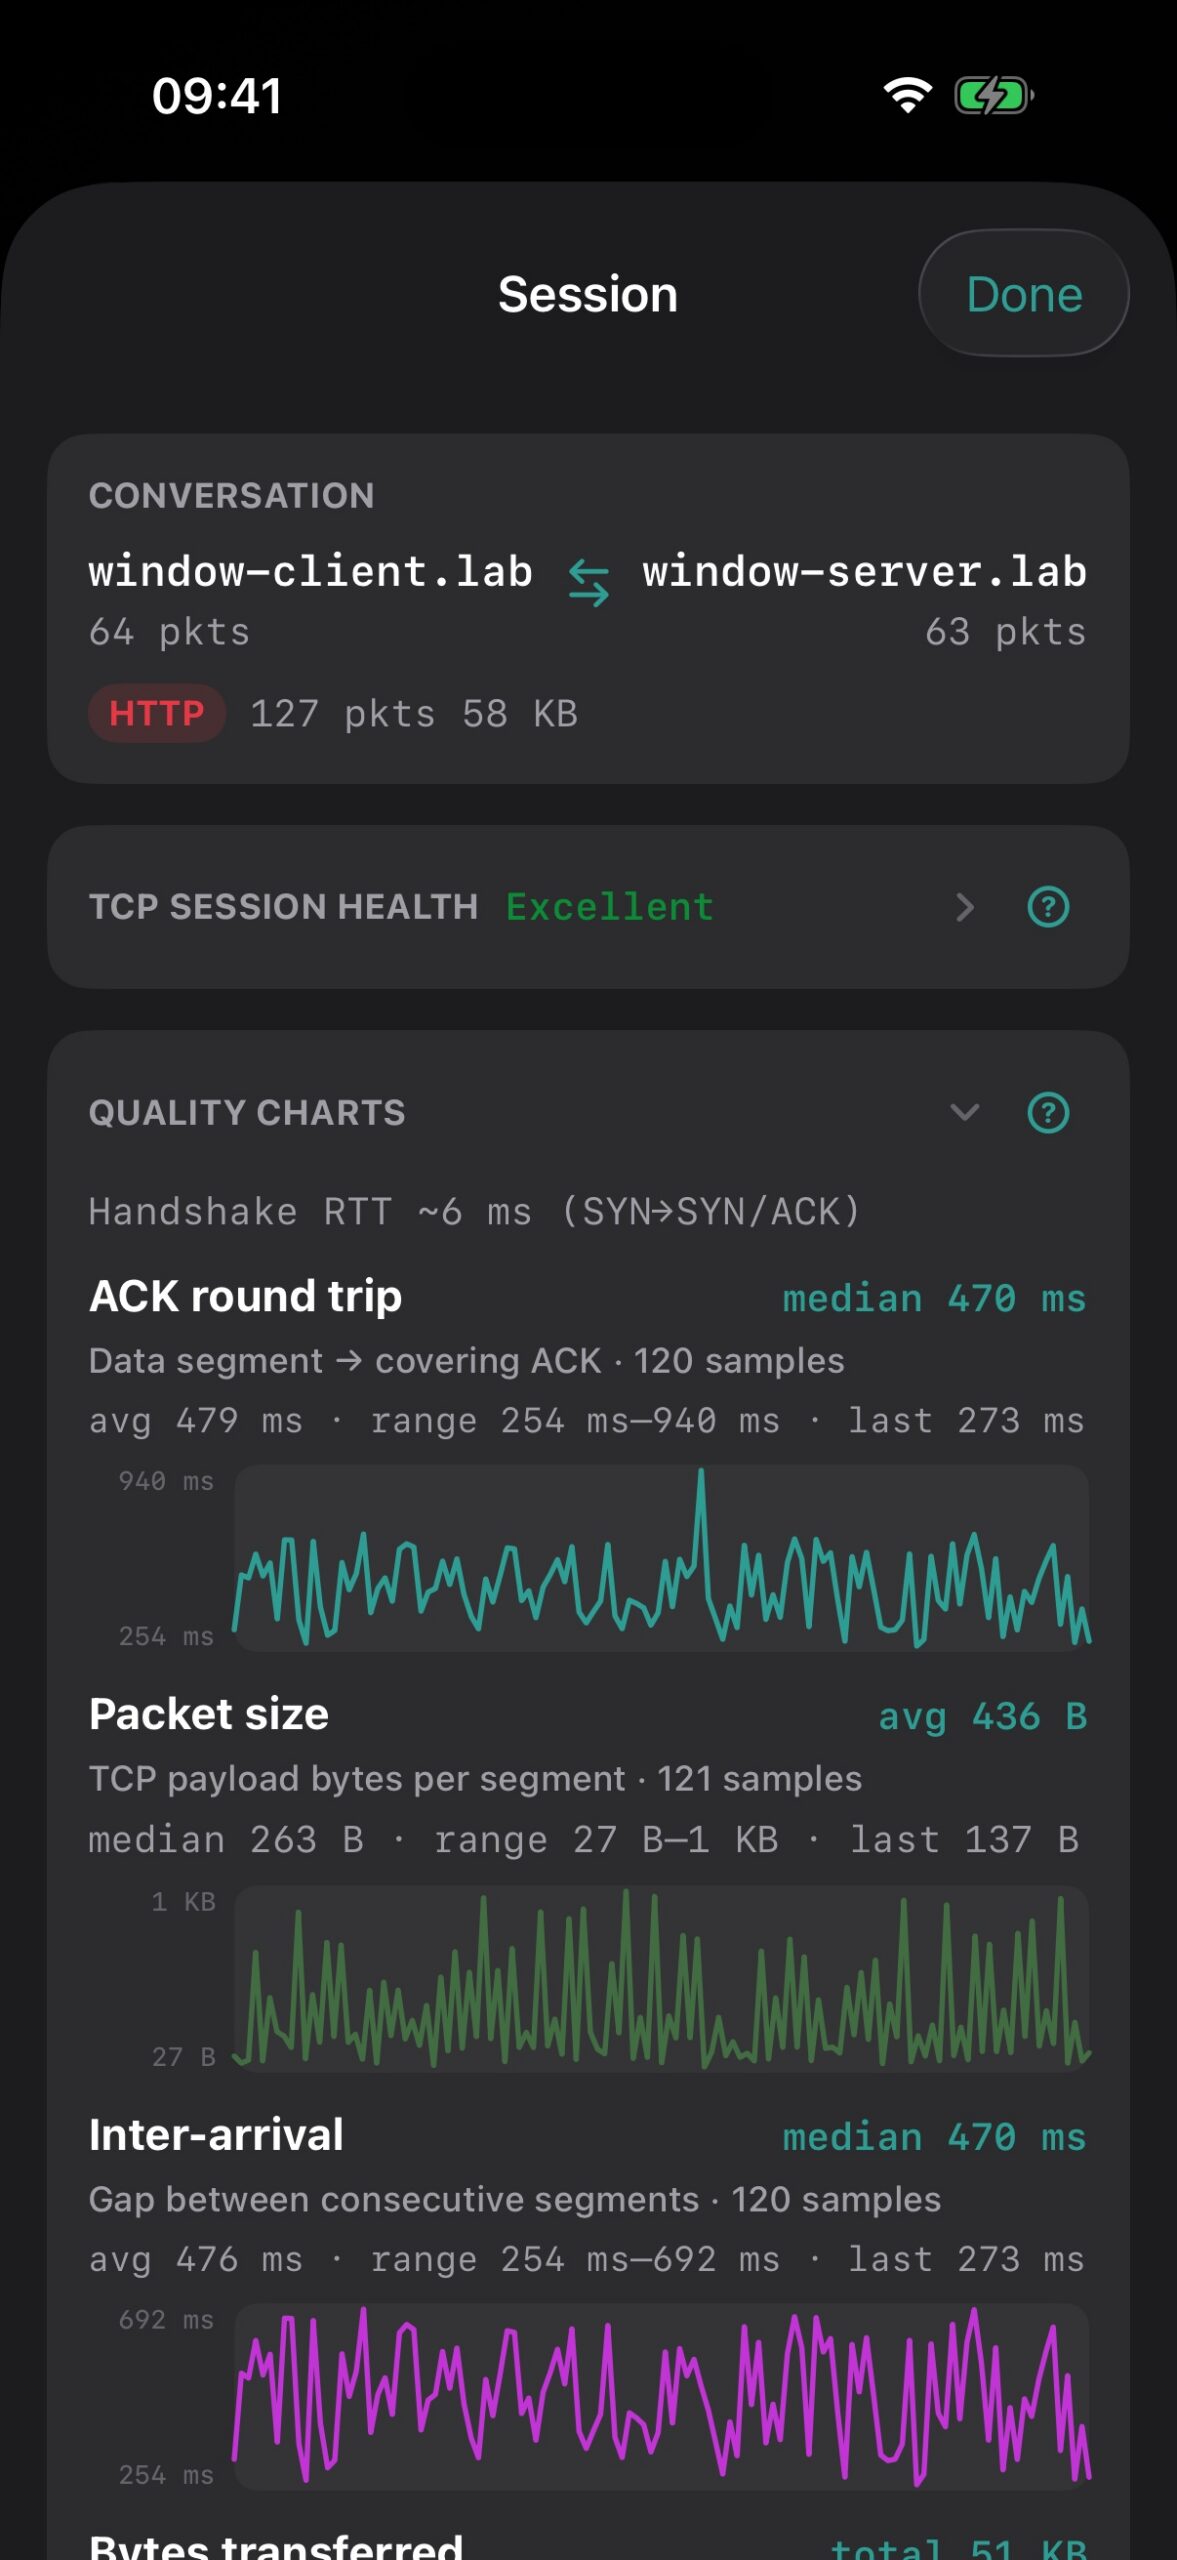
Expert follows the socket (1.2.6): pick a socket (for example TCP 80) and the Expert list shows only that service’s findings, that socket’s TCP health, and host-wide network/link findings — not FTP or mail alerts from the same pair of hosts. A short note flags when more findings sit on other sockets. An Other sockets list at the bottom switches sockets in one tap, with a warning marker on the ones that have alerts; Whole conversation is one tap away.
3.3 Follow TCP Stream
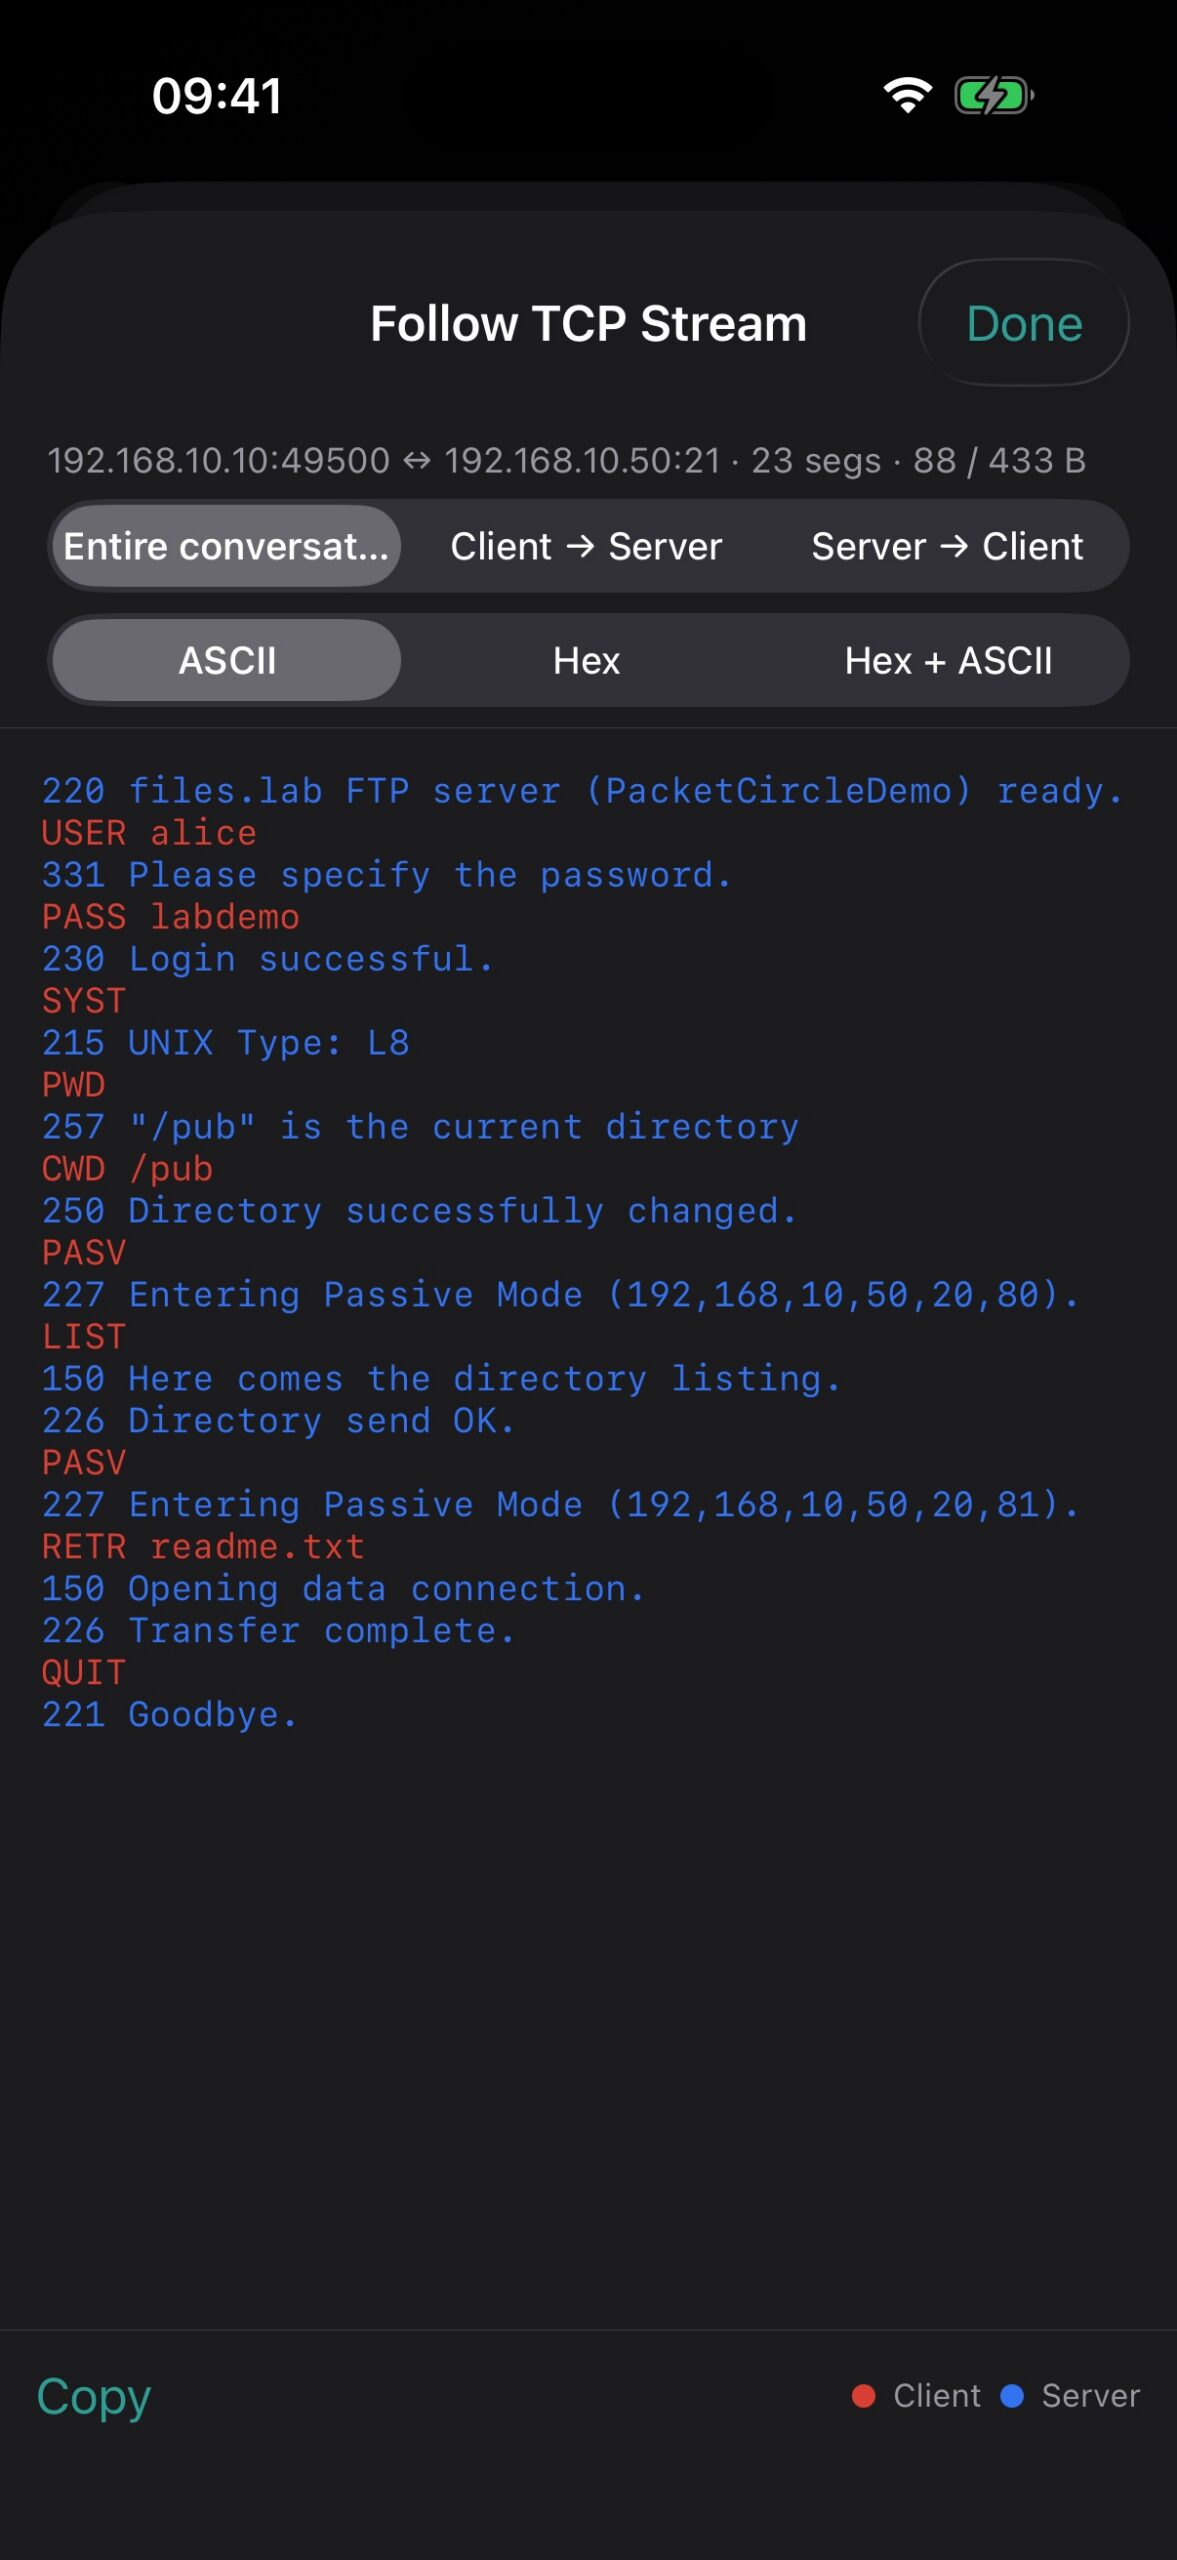
From Session, open Follow TCP Stream to reassemble payload bytes for one TCP flow (budget-limited on device).
3.4 Talkers
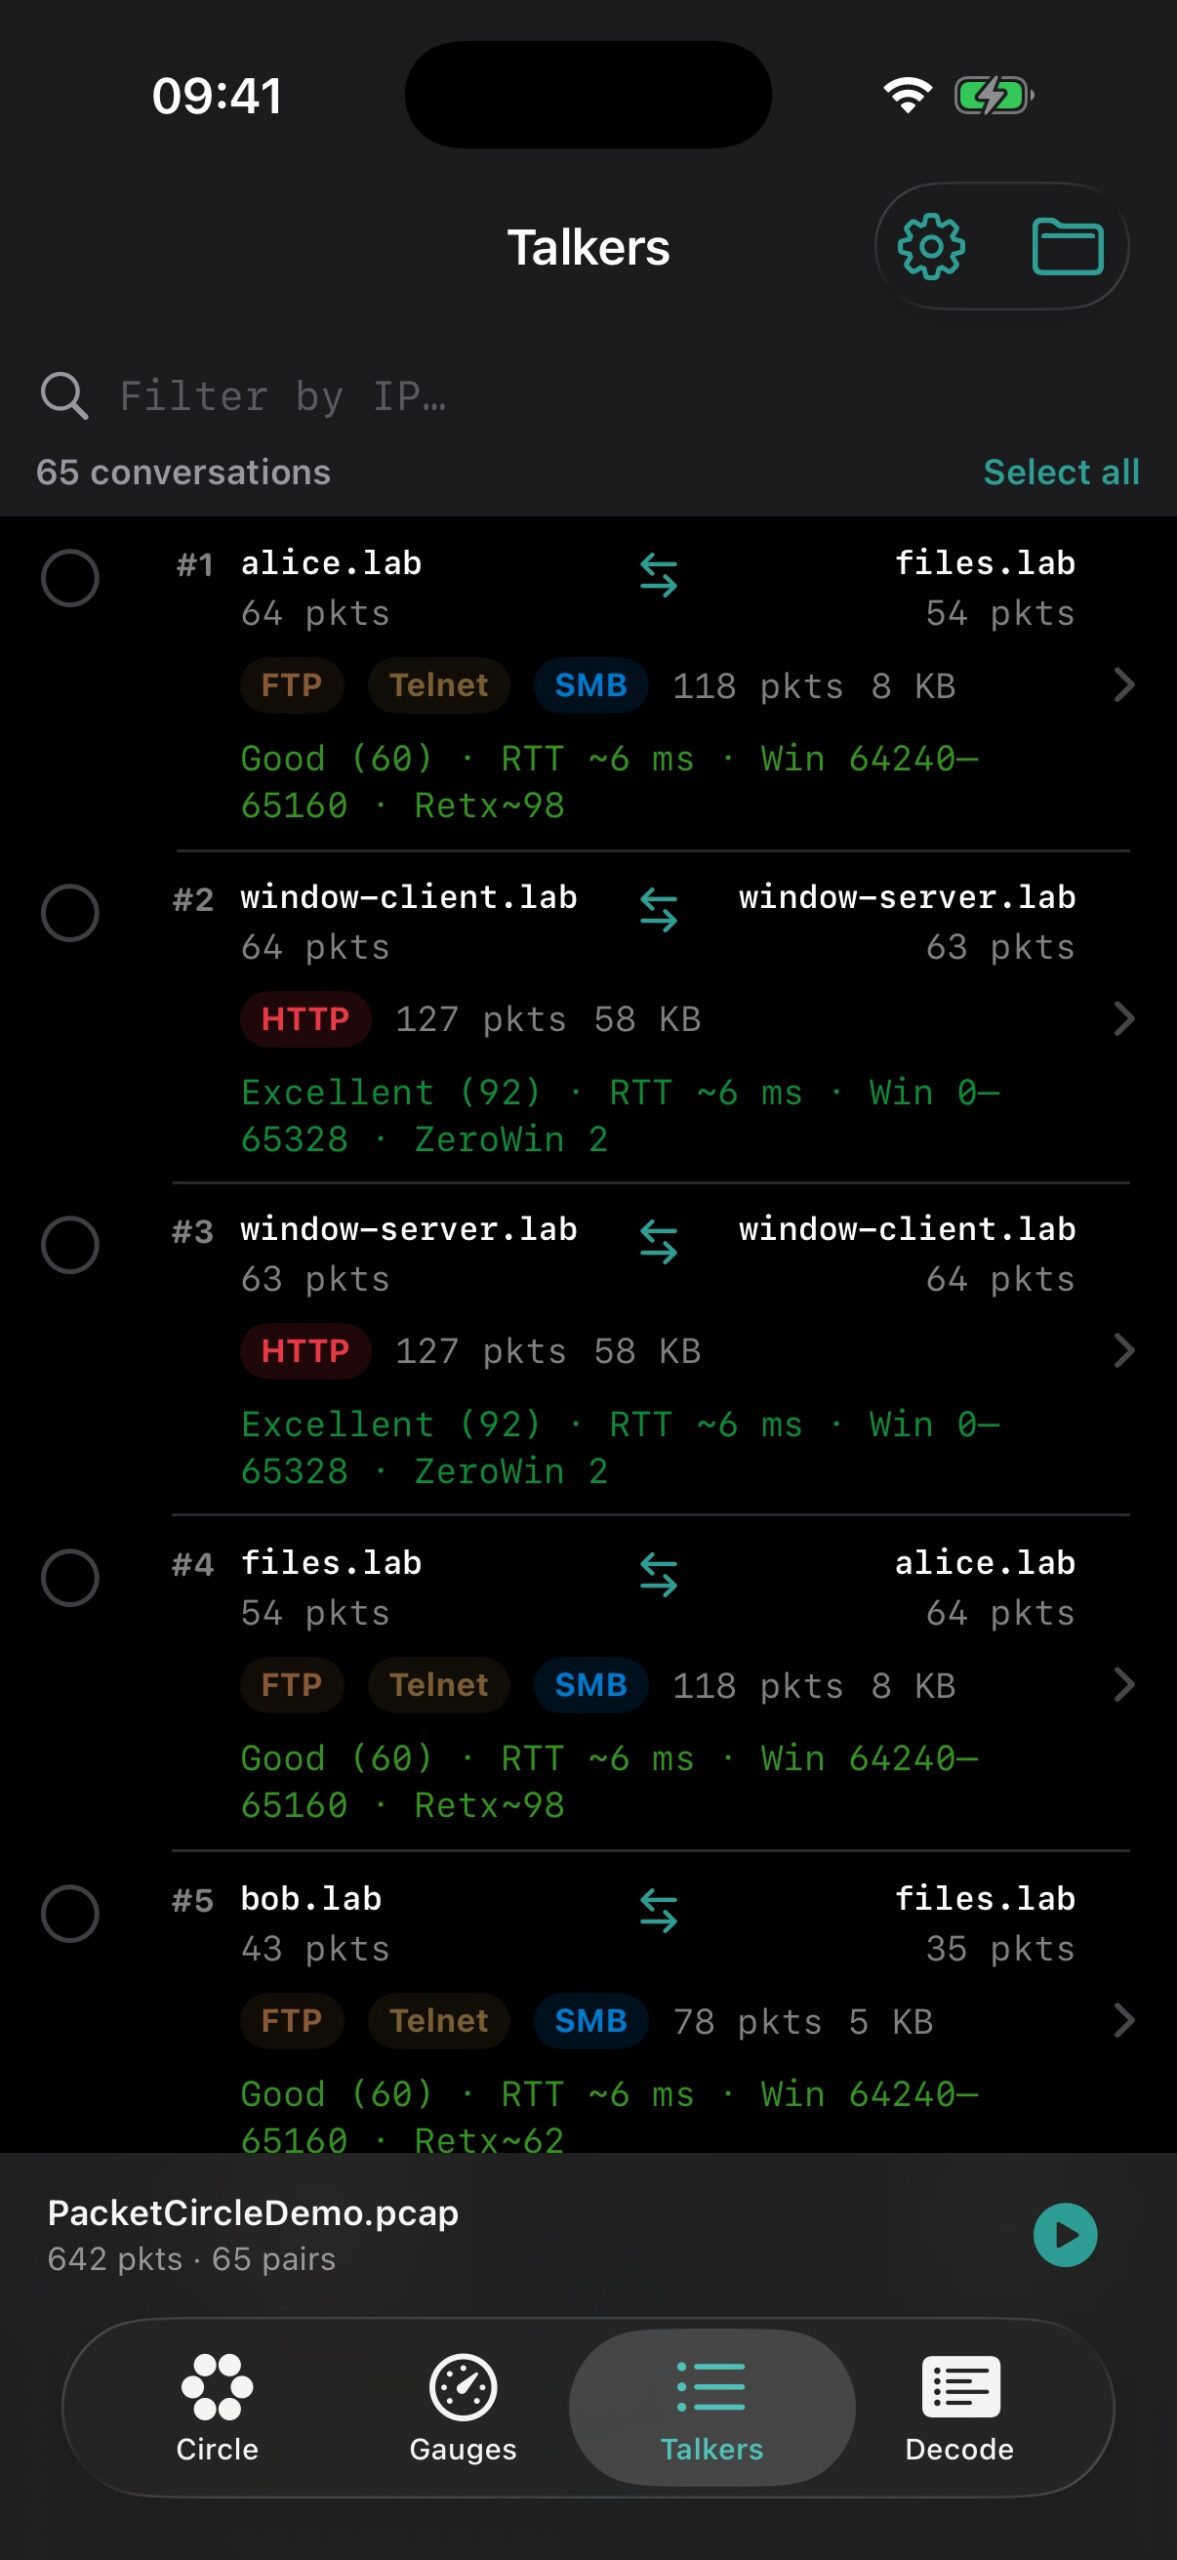
List of analyzed IP pairs ranked by volume, with protocol chips, quality grade, and TCP hints. Filter by IP; limit top 10 / 25 / 50. Tap a row for Session.
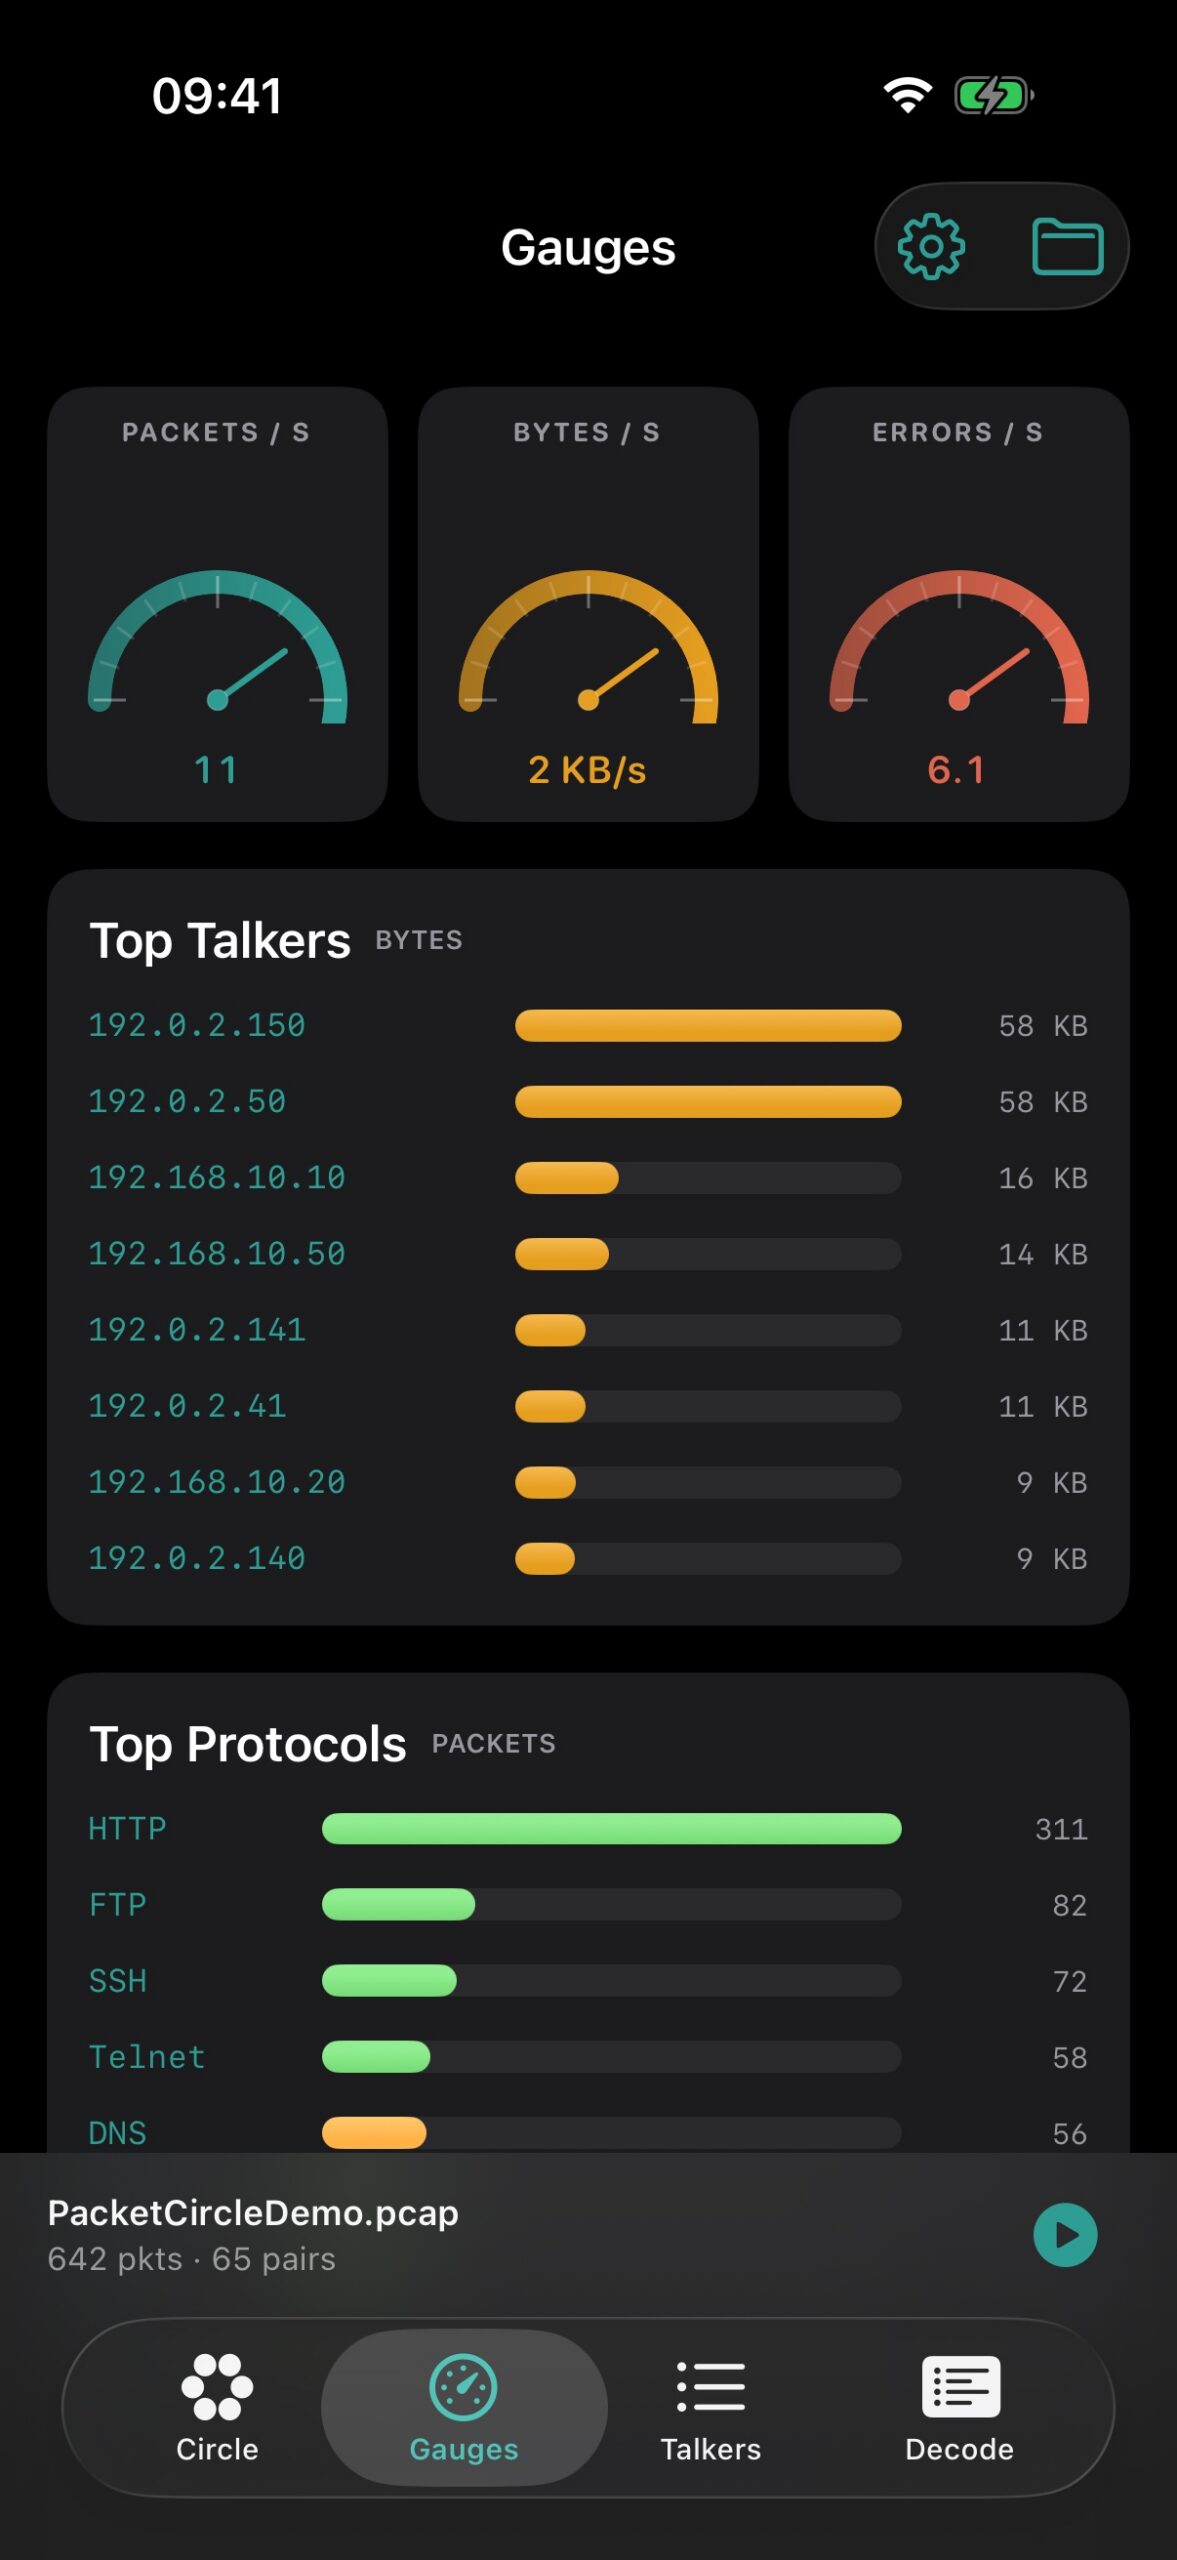
3.5 Gauges
High-level rates and distributions: packets/s, bytes/s, errors/s, top talkers by bytes, top protocols by packets, and Degraded Quality Conversations.
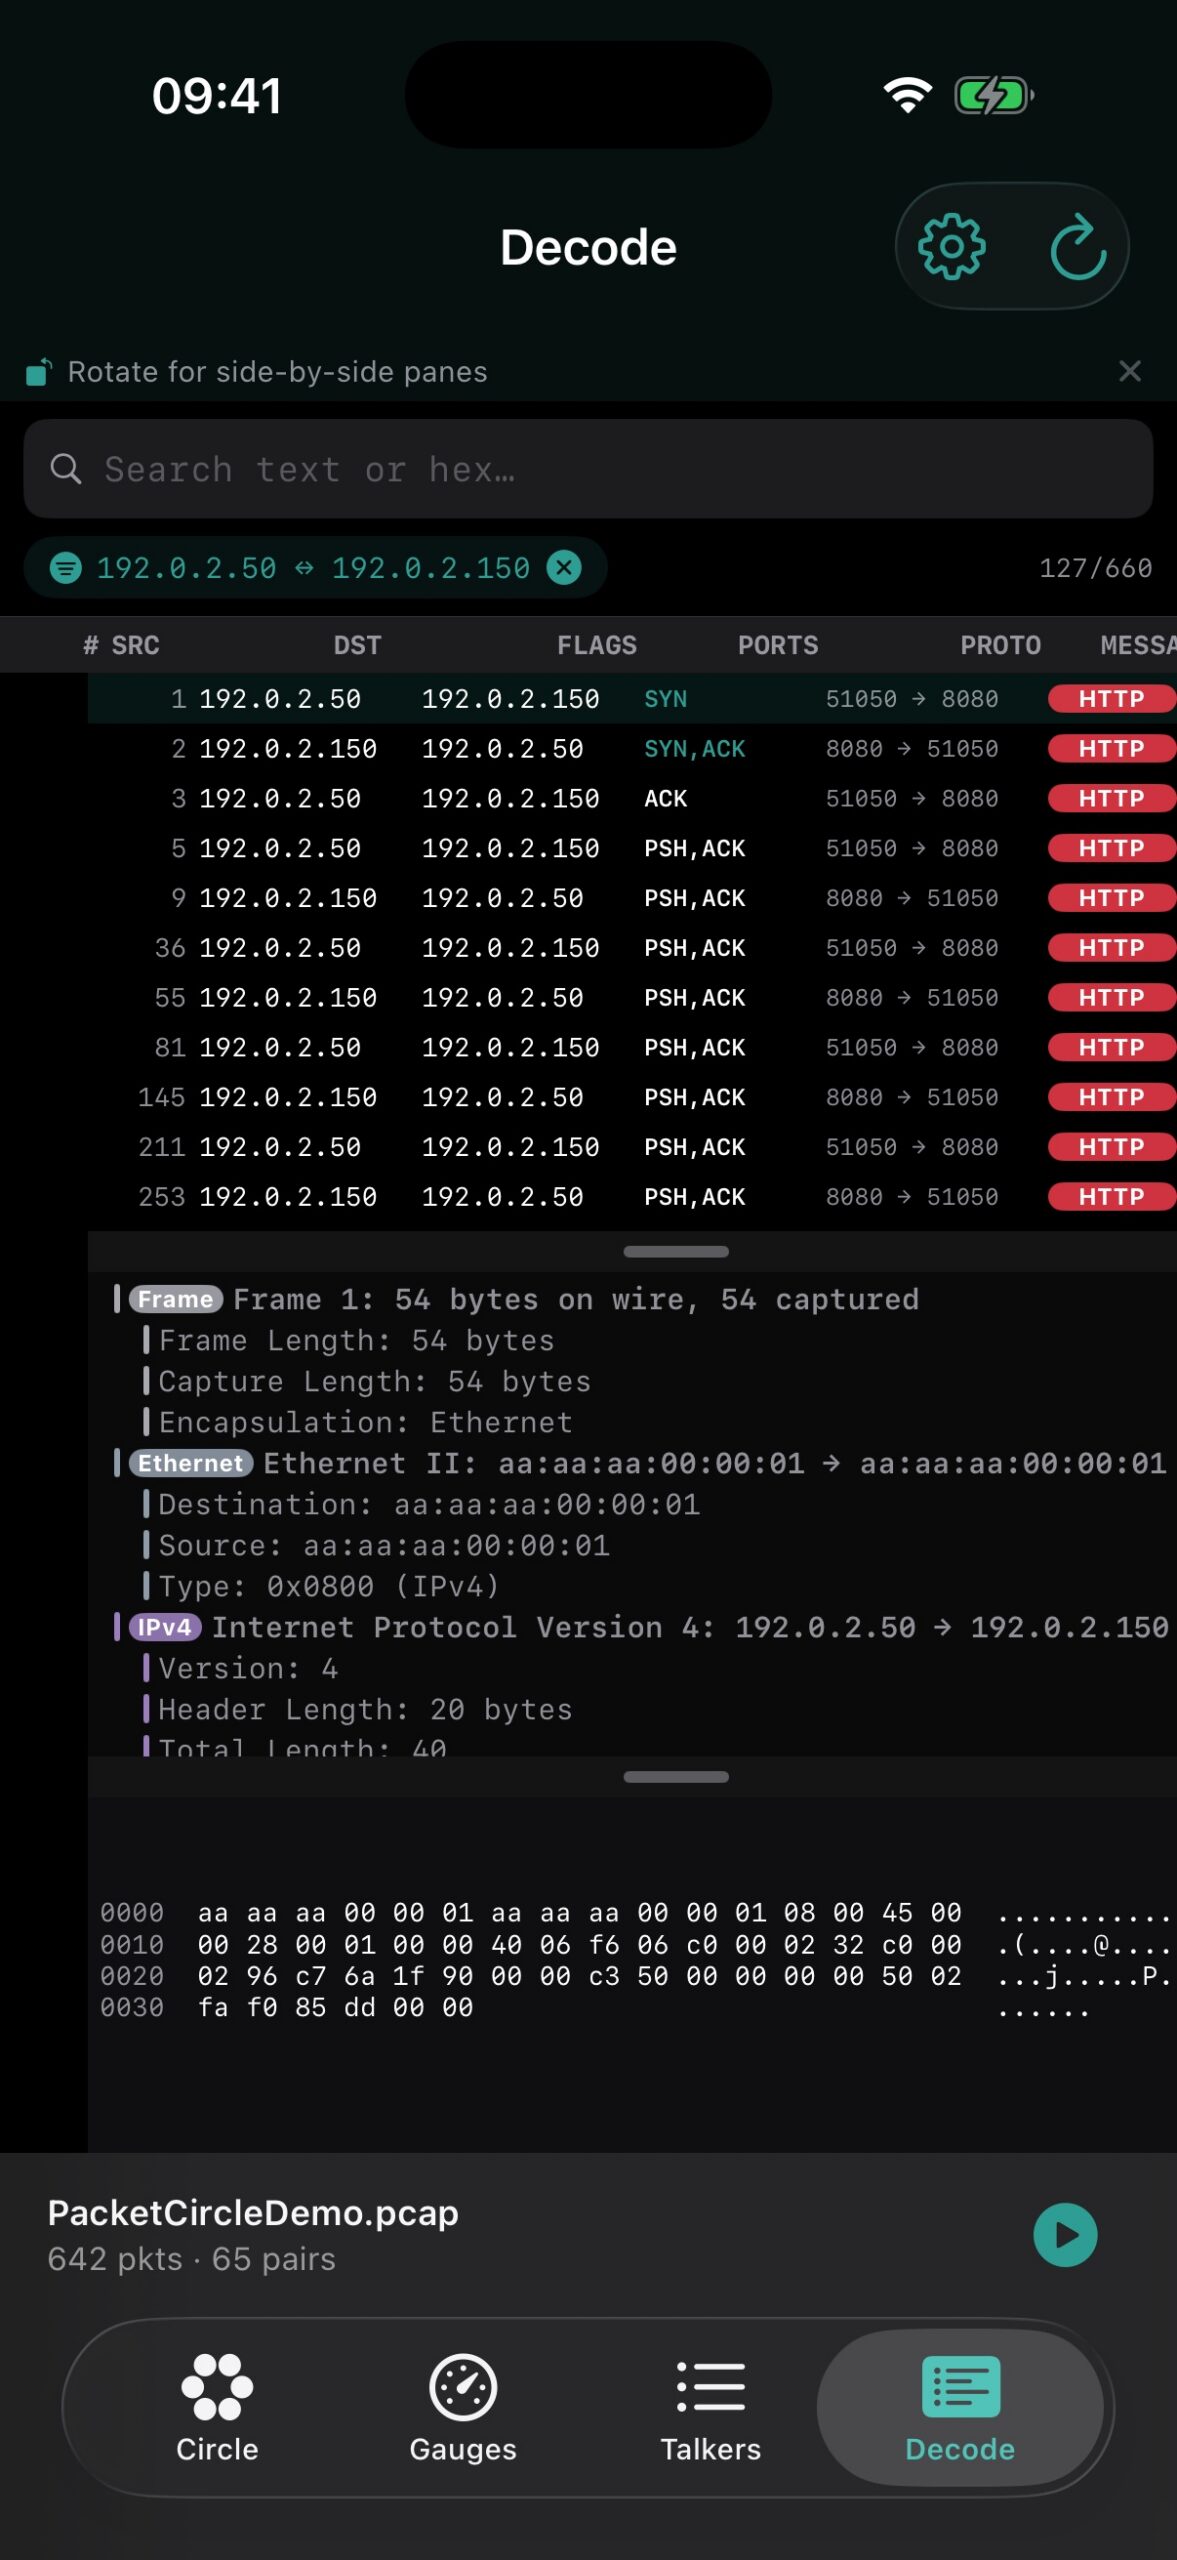
3.6 Decode
Packet list + protocol tree + hex/ASCII for frames loaded into the Decode budget (default 5,000; Options can raise it). A Wireshark-style display filter sits beside text/hex search, with autocomplete limited to fields PacketCircle actually decodes — unknown names turn the box red instead of silently matching. Per-frame Expert Info (severity tint) appears when a single packet is enough to raise it.
3.7 PCAP over IP — remote capture (1.2.5)
PacketCircle connects out to a remote pcap stream (TCP@host:57012), the same convention Wireshark uses with -k -i TCP@host:port. The phone never sniffs its own Wi-Fi or cellular traffic — the other side must already be sending a PCAP stream, for example from the pcapoverip broker (single-file, free, GPL-2.0) or PolarProxy. See PacketTools → PCAP over IP for the broker link and a diagram of how it works.
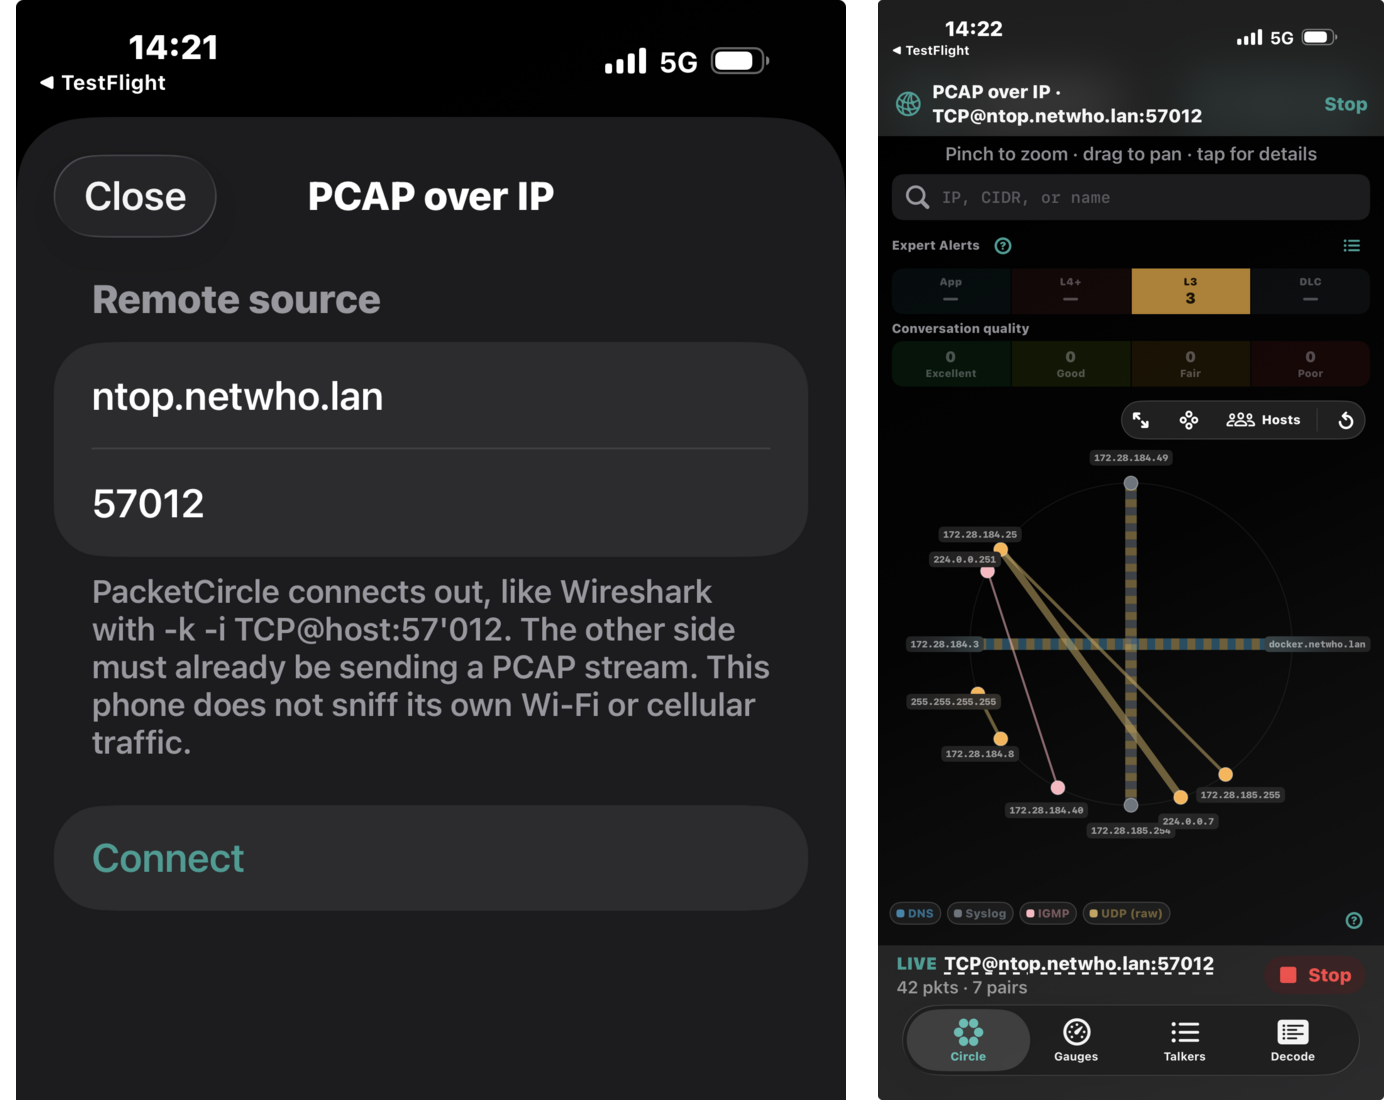
Options → PCAP over IP opens the connect sheet once Options is dismissed. Nothing is captured until PacketCircle connects; the sensor streams only what crosses the interface you point it at.
3.8 Sanitize Capture & Generate Report (1.2.5)
Tap the file name above the tab bar → Capture details, or Options → Capture tools, for:
| Tool | What it does |
|---|---|
| Sanitize Capture… | Native streaming scrub — sanitize all payload, only clear-text payload, or payload + IP/MAC anonymization — with checksum fixups. Writes a new PCAPNG; the original file is never modified. The same modes as the PacketSanitizerPro Wireshark plugin, on device. |
| Generate Report… | Native PDF report (file summary, charts, port/TCP analysis) using the same pipeline as the Mac app and PacketReporterPro. |
3.9 Options
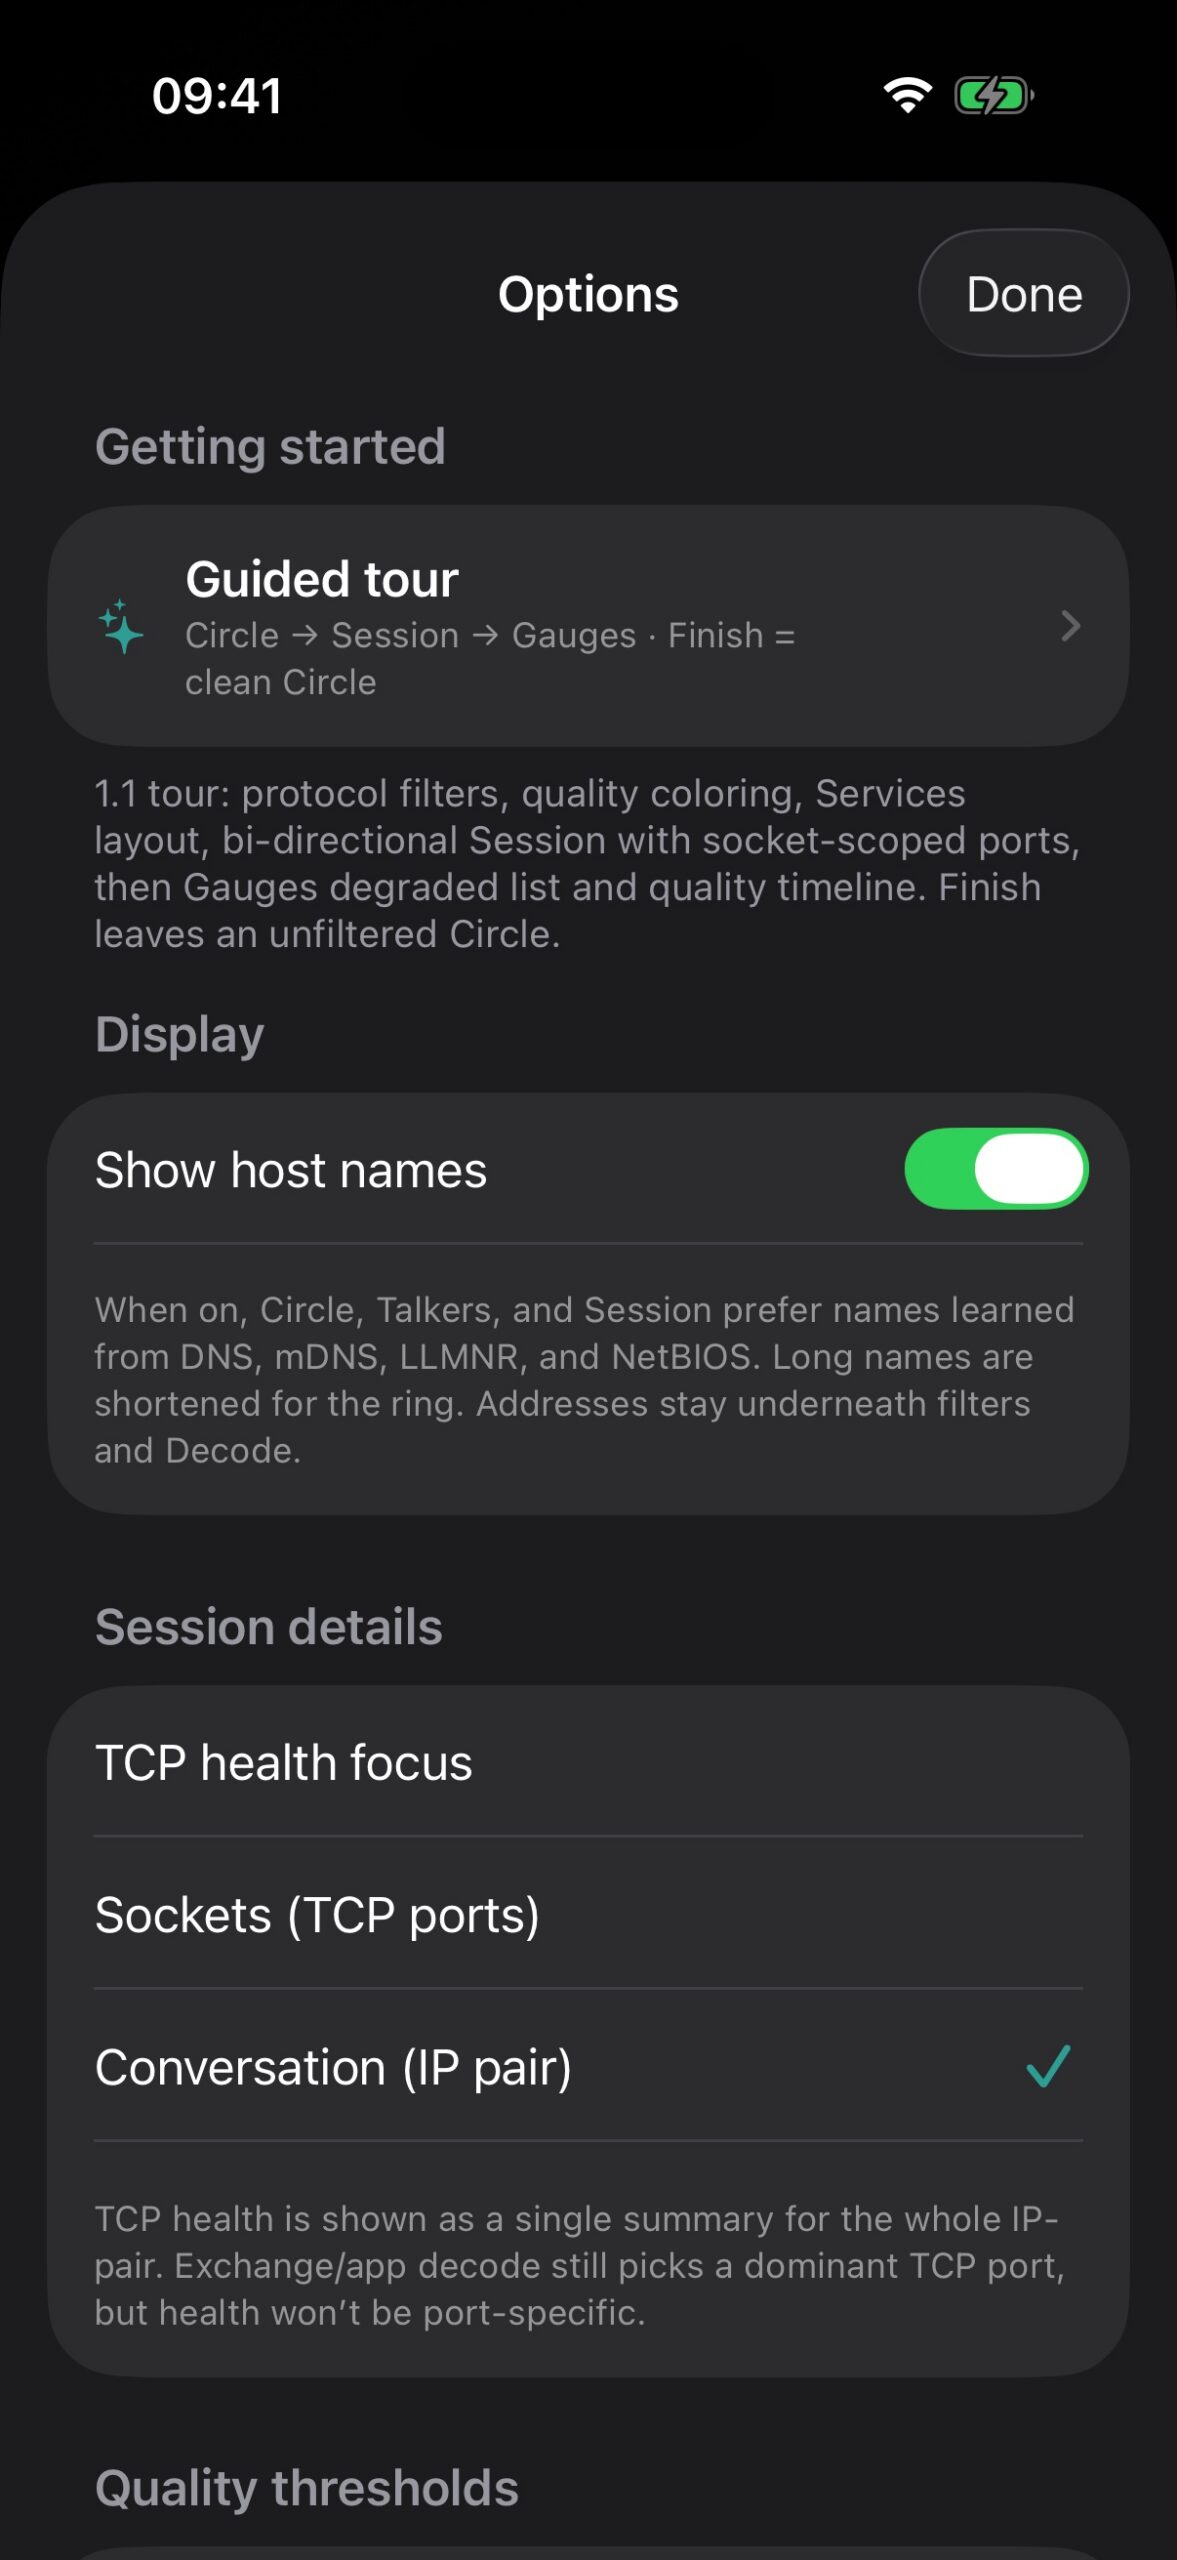
| Setting | Purpose |
|---|---|
| Guided tour | Replay demo and coach-marks Circle → Session → Follow / Decode |
| TCP health focus | Sockets (TCP ports) vs Conversation (IP pair) |
| Quality thresholds | Lenient / Balanced (default) / Strict |
| Show host names | On by default (1.2.5+) — shortened DNS / mDNS / NetBIOS names on Circle, Talkers, Session |
| Follow TCP Stream budget | 64–1024 KB reassembly |
| Decode list | 500–10,000 frames |
| Circle | Show/hide the Expert Alerts strip, the conversation quality bar, and the Map layout |
| Capture tools | Sanitize Capture… and Generate Report… (need an open file) |
4. Workflows
A. First look at a capture
Open the file, a PCAP over IP stream, or the demo. On Circle, skim arcs and the protocol legend. Switch to quality coloring; tap Poor / Fair to solo problem edges. Open Talkers for ranked volume, or tap an edge for Session.
B. Diagnose a bad TCP session
Quality mode → filter Poor (or find the pair on Talkers). Open Session → read health (retransmits, RST, zero-window, RTT). If multiple ports: pick the socket, then check the Other sockets list for related findings. Follow TCP Stream or Decode for payload/context.
C. Expert triage
Watch the Expert Alerts strip (App / L4+ / L3 / DLC) on Circle. Tap a band to filter, or touch-and-hold for the alert list. Read the Expert panel on Session for that socket; open Decode for tree + Expert Info.
D. Remote / live triage over PCAP over IP
Point a sensor at pcapoverip or PolarProxy, then Options → PCAP over IP → connect. Traffic streams onto the Circle as it arrives — same workflow as a loaded file once connected.
E. Share a capture safely
Capture details → Sanitize Capture… — choose a scrub mode, save the PCAPNG, hand it off. Generate Report… for a PDF summary instead of (or alongside) the raw file.
5. Built-in demo capture
PacketCircleDemo.pcap ships with the app for the Guided tour and offline exploration: mixed cleartext lab traffic (HTTP, FTP, SSH, Telnet, DNS, SMB…), corporate-LAN stories that exercise App / L3 / DLC experts, isolated Excellent / Good / Fair / Poor quality examples, and a receive-window lab for the quality charts.
6. Related documentation
| macOS User Manual | The desktop half of PacketCircle Native |
| Updates & Blogs | Release notes for every PacketCircle version |
| PCAP over IP explainer | How the remote-capture broker works, and where to get one |
| PacketCircle for iPhone | The original App Store launch write-up |
| App Store listing | Install PacketCircle on iPhone / iPad |